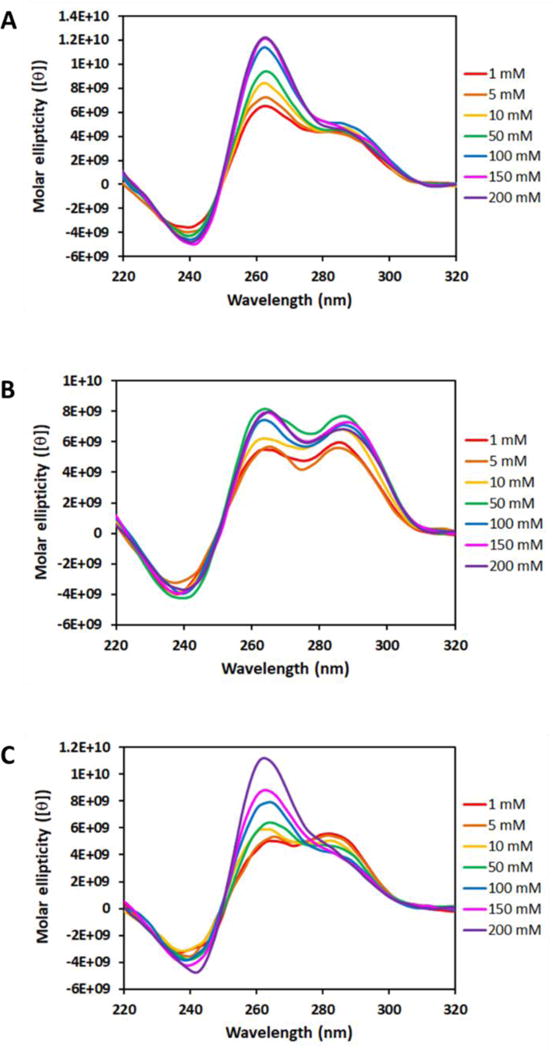
Figure 8.

The effect of different K+ concentrations on the CD profiles of NEIL3 PQS without an OG (A) and with an OG in the loop (B) or core (C) position. For conciseness, only the CD spectra for 5-track sequences are presented here due to comparability with those of 4-track sequences.
