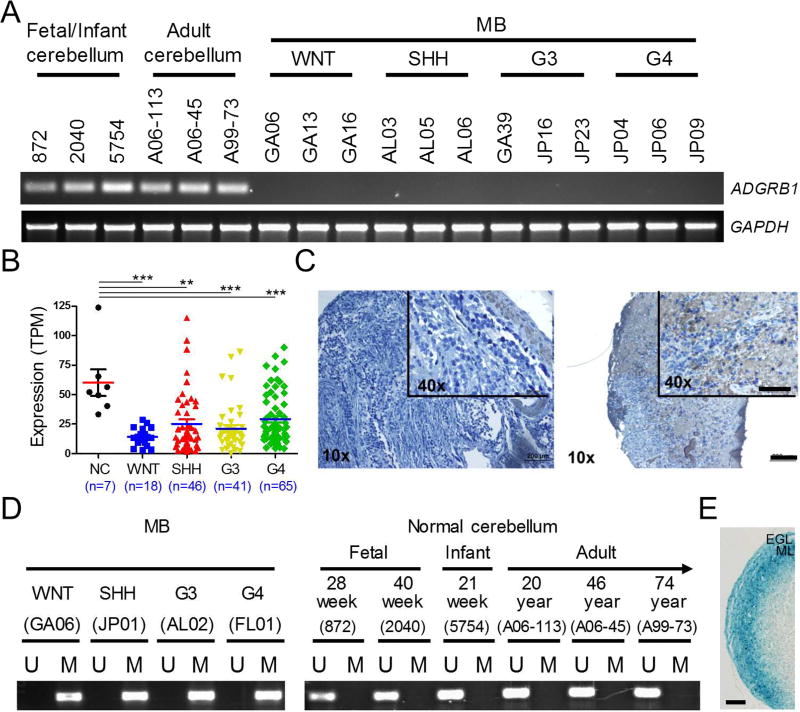
Figure 1. Epigenetic Silencing of ADGRB1/BAI1 Expression in MB.
(A) RT-PCR analysis of ADGRB1 mRNA expression in patient MB tumors and normal human fetal, infant and adult cerebellum. GAPDH was used as a control.
(B) Analysis of ADGRB1 mRNA levels in 7 normal cerebella (NC) and 170 MB samples by RNA-Seq (Northcott et al., 2017). TPM, Transcripts Per Kilobase Million. Individual data points with the mean ± SEM are shown. *** p<0.0001, ** p<0.01, t test.
(C) IHC staining of BAI1 in a de-identified, formalin-fixed, paraffin-embedded tissue array containing 60 MBs shows low (51 cases; score 0–4) or moderate (9 cases; score 6–9) BAI1 expression. Scale bar, 200 µm. For inset, scale bar, 100 µm.
(D) MS-PCR analysis of DNA methylation in the CpG island of the ADGRB1 promoter. Representative results (n=3) of 1 sample from each MB group and 6 normal cerebella are shown.
(E) β-Gal staining for Adgrb1 promoter activity in Adgrb1-LacZ reporter mice at postnatal day 10 (P10). ML, molecular layer. Scale bar, 100 µm.
See also Figures S1, S2 and Table S1.

