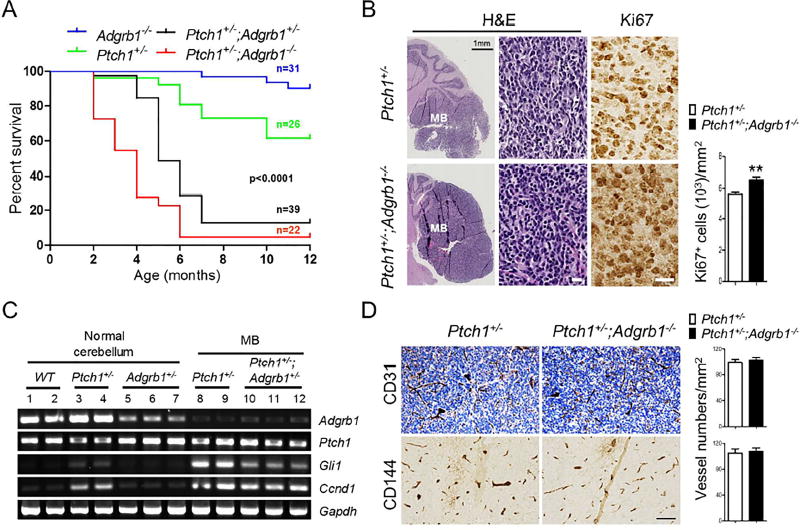
Figure 3. Adgrb1 Loss Increases Penetrance and Accelerates Tumor Growth in the Ptch1+/− SHH-MB Mouse Model.
(A) Kaplan-Meier curves show the survival of Ptch1+/− mice in the presence of hemi- or homozygous deletion of Adgrb1 (p<0.0001; log-rank test).
(B) H&E staining of 5-month-old Ptch1+/− and Ptch1+/−;Adgrb1−/− mouse cerebella with tumor. IHC shows Ki67 staining in tumor cells and quantification is shown by histogram, p=0.005, t test, n=6. Scale bar, 30 µm.
(C) RT-PCR analysis of mRNA expression of Adgrb1, Ptch1 and SHH pathway markers (Gli1 and Ccnd1) in adult normal cerebellum and MB from mice with indicated genotypes.
(D) Representative images show IHC staining for endothelial cell markers CD31 (top) and CD144 (VE-cadherin, bottom) in 5-month-old mice MB. Scale bar, 100 µm.
All histogram data represent mean ± SEM. See also Figure S3.

