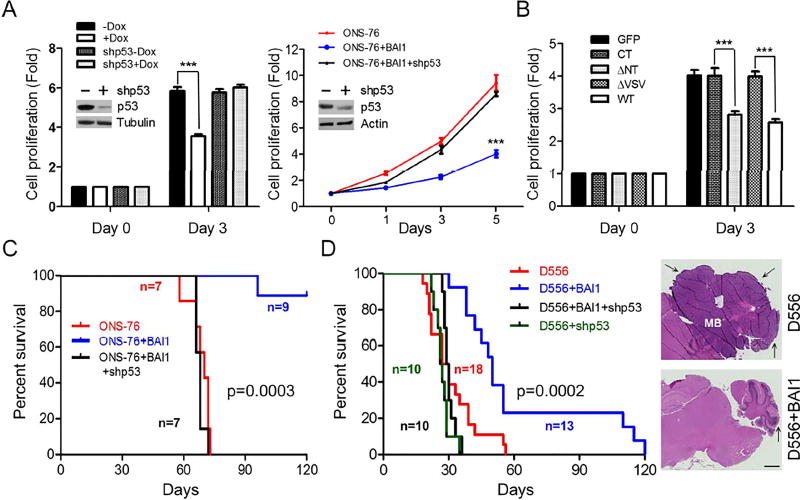
Figure 5. BAI1 inhibits MB Growth in vitro and in vivo in a p53-dependent manner.
(A) Left, cell proliferation of D556+BAI1 (tet-on) cells with stable p53 knockdown upon BAI1 induction. Fold is the ratio of live cells on day 3/day 0. Right, cell proliferation of ONS-76 MB cells with stable transfection of BAI1 +/− p53 shRNA lentivirus was measured for 5 days. Efficiency of shRNA-mediated knockdown was evaluated by Western blots (insets). ***, p<0.0001, 2-way ANOVA, n=3.
(B) Effect of BAI1 WT and mutants on ONS-76 cell proliferation. Fold is the ratio of live cells on day 3/day 0. ***, p<0.0001, 2-way ANOVA, n=5.
(C) Kaplan-Meier curves show the survival of mice with intracranial xenografts of ONS-76 cells infected by lentiviral-expressed BAI1 +/− stable p53 knockdown (p=0.0003; log-rank test).
(D) Kaplan-Meier curves show the survival of mice with intracranial xenografts of D556 cells infected by lentiviral-expressed BAI1 +/− stable p53 knockdown (p=0.0002; log-rank test). Right, representative images show H&E staining of MB sections, and arrows show tumor. Scale bar, 1 mm.
All histogram data represent mean ± SEM. See also Figure S5.

