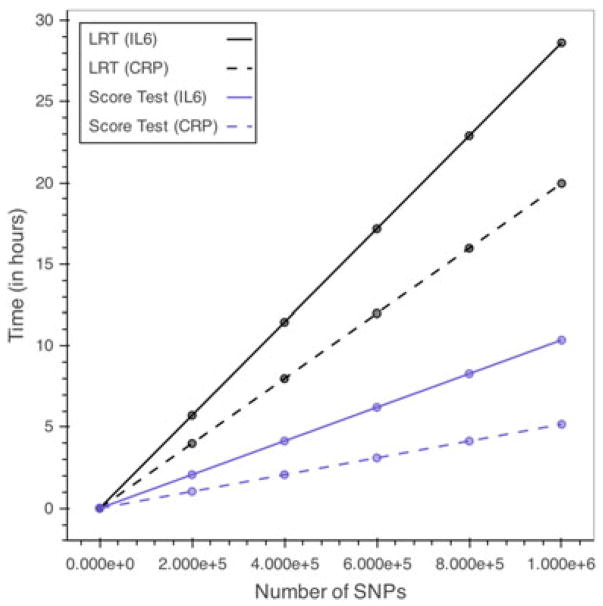
Figure 1.
Expected computation times for single-SNP analysis using LRT and score-based test. Estimated computation times are based on a MacBook Pro using a single 2.5 GHz Intel Core i7 processor assuming complete data on n = 150 individuals. Full and reduced models are fitted using the lmer() function of the lme4 package, and the LRT is performed using the anova() function in R version 3.3.0. The score test statistic is calculated on the basis of the formula of Equation (7). SNP, single nucleotide polymorphism; LRT, likelihood ratio test; IL-6, interleukin-6; CRP, C-reactive protein. [Colour figure can be viewed at wileyonlinelibrary.com]

