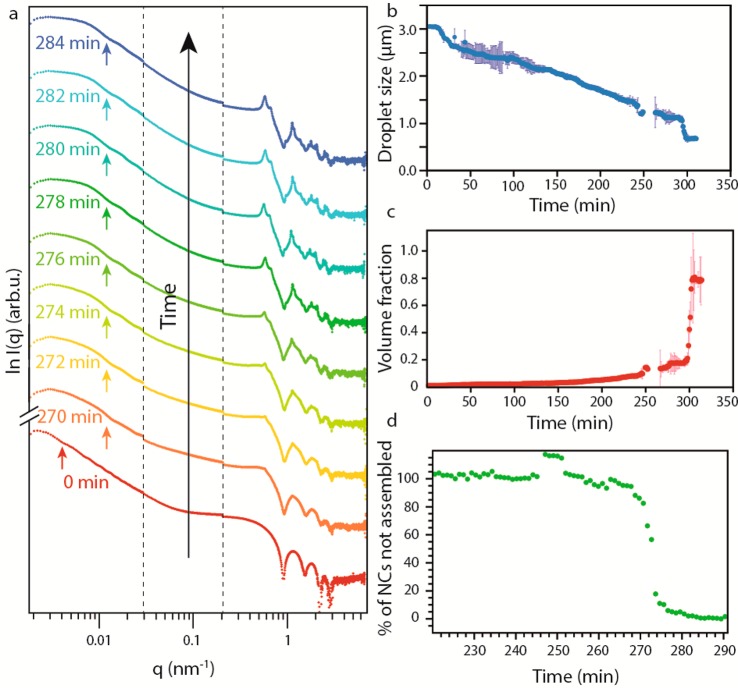
Figure 2.
Time-resolved X-ray scattering patterns of the self-assembly. (a) Scattering patterns of the emulsion over time; the crystallization in ordered SPs is confirmed by the appearance of structure factor peaks in the region associated with NC scattering. The arrows indicate the first minima of the form factor relative to the scattering from the droplets/SPs. (b) Droplet size as a function of the reaction time. The error bars in dark blue show the error in the determination of the size relative to each point. (c) Volume fraction of NCs in the droplet as a function of time. The error bars in light red show the error in the determination of the volume fraction relative to each point. (d) Percentage of NCs not assembled in an SP over time; the crystallization is highlighted by the sharp change in the slope of the curve.

