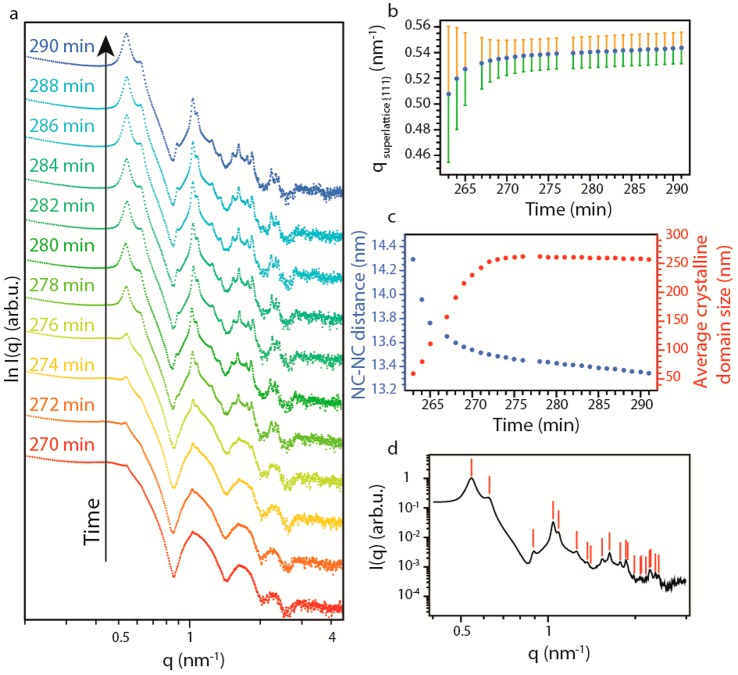
Figure 3.
Crystallization of the NCs in FCC SPs. (a) SAXS patterns at high q at different times during the crystallization. (b) Variation of the peak position (dots) and relative peak width (lines) of the first structure factor peak (0.5 nm–1) over time. (c) Variation of the NC–NC distance (blue) and average crystalline domain size (red) over time. (d) Indexing of the first 21 reflections of an FCC lattice in the scattering pattern of the SPs.

