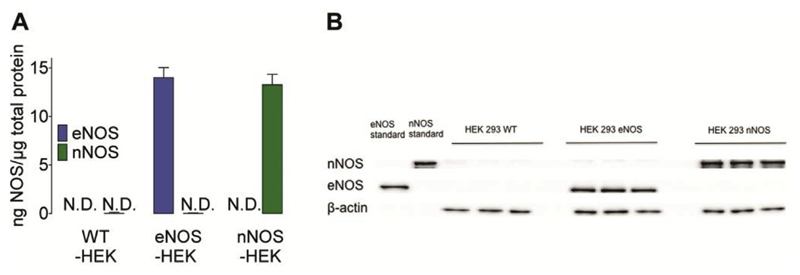
Fig. 2. Western Blot analysis of nNOS and eNOS expression in HEK-cell clones.
(A) Bars represent the expression rate of eNOS (blue bars) and nNOS (green bars) in wild-type (left panel, n = 3), eNOS- (middle bars, n = 3) and nNOS-expressing HEK293 cells (right bars, n = 3). (B) Representative Western blot of total homogenates of wild-type, eNOS- or nNOS-expressing HEK293 cells (10 μg of protein) probed for eNOS (140 kDa), nNOS (155 kDa) and β-actin (43 kDa) expression (n = 3). Mean values are shown ±SD, *P < 0.05 versus control using unpaired t-test. (For interpretation of the references to colour in this figure legend, the reader is referred to the web version of this article.)

