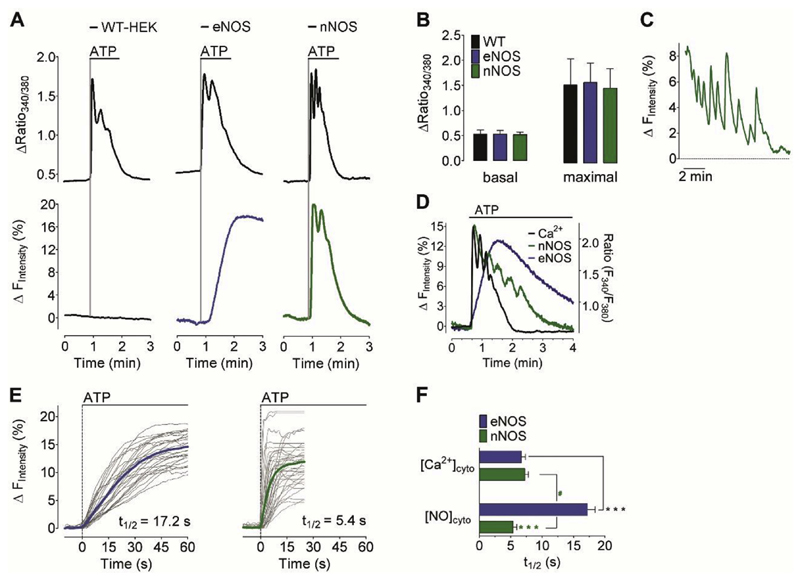
Fig. 3. Ca2+-triggered eNOS- and nNOS-specific NO signals.
(A) Representative time course of cytosolic Ca2+ (upper panel) and NO signals (lower panel) in response to 100 μM ATP in wild-type HEK293 cells (left panel), stably eNOS-expressing HEK293 cells (middle panel), and stably nNOS-expressing HEK293 cells (right panel). NO recordings were performed using C-geNOp. (B) Bars represent mean values in ±SD of basal fura2 ratios (left panel) and maximum cytosolic Ca2+ elevations in response to 100 μM ATP (right panel) of wild-type HEK293 cells (black bars, n = 52/12), eNOS expressing HEK293 cells (blue bars, n = 53/12) and nNOS expressing HEK293 cells (green bars, n = 65/12). (C) Representative pulsatile NO signals in nNOS-expressing HEK cells (D) Overlay of representative cytosolic Ca2+ (black curve) and NO recordings of stably nNOS- (green curve) or eNOS- (blue curve) expressing HEK293. Experiments were at least performed 4 times. (E) Single cell NO responses (light grey curves) and mean curves of eNOS-expressing HEK cells (blue curve, n = 5/32) and nNOS-expressing HEK cells (green curve, n = 5/37). (F) Bars represent the half time (t1/2) of maximum fura-2 ratio (upper blue bar, n = 54/4 for eNOS-expressing cells; upper green bar, n = 66/4 for nNOS expressing cells) and C-geNOp (lower blue bar, n = 32/3 for eNOS-HEK cells and lower green bar, nNOS-expressing cells) signals triggered by 100 μM ATP. Mean values are shown ±SD, *P < 0.05 versus control using unpaired t-test. (For interpretation of the references to colour in this figure legend, the reader is referred to the web version of this article.)

