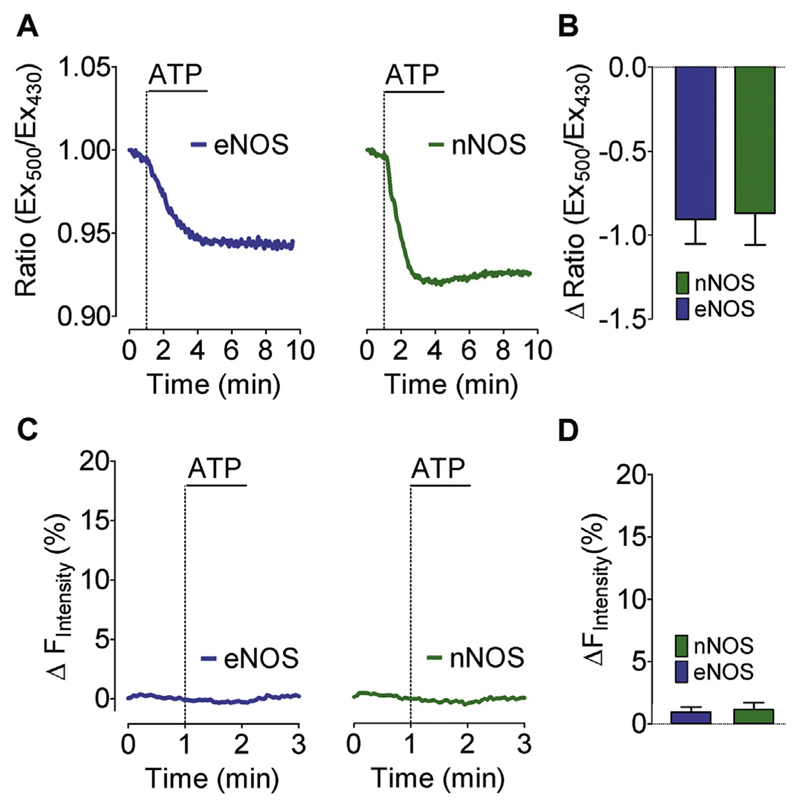
Fig. 4. pH sensitivity of geNOps.
(A) Representative time course of cytosolic pH changes in response to 100 μM ATP in eNOS-HEK cells (left panel) and nNOS-HEK cells (right panel) expressing the cytosolic SypHer. (B) Bars represent mean values in ±SD of maximal sypHer ratio changes in response to 100 μM ATP of eNOS-HEK cells (blue bars, n = 4/41) and nNOS-HEK cells (green bars, n = 4/46). (C) Representative time course of NO signals of eNOS-HEK cells (left panel) and nNOS-HEK cells (right panel) to 100 μM ATP. Cells were transiently transfected with the NO insensitive geNOpmut. (D) Bars represent mean values in ±SD of maximal geNOpmut responses upon administration of 100 μM ATP of eNOS-HEK cells (blue bars,n = 4/21) and nNOS-HEK cells (green bars, n = 4/21). Mean values are shown ±SD, *P < 0.05 versus control using unpaired t-test. (For interpretation of the references to colour in this figure legend, the reader is referred to the web version of this article.)

