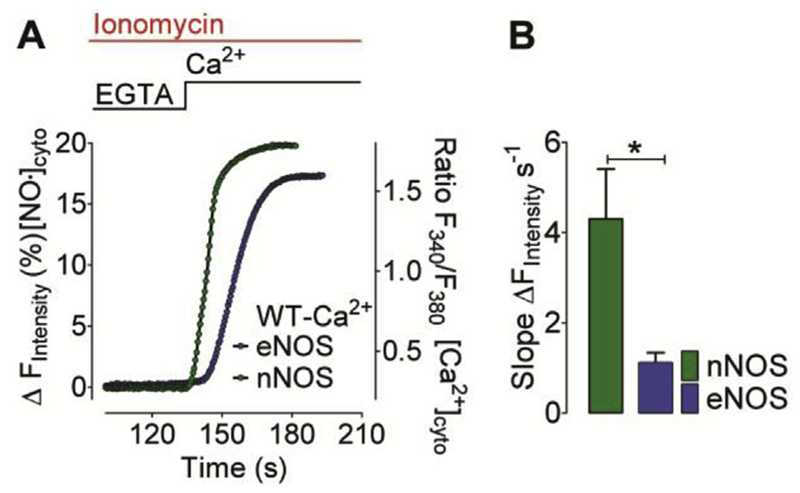
Fig. 5. Ca2+-evoked nNOS- and eNOS-derived NO generation profiles in ionomycin permeabilized cells.
(A) Mean curves represent NO generation profiles derived from eNOS (blue curve) and nNOS (green curve) in response to Ca2+ addition. Experiments were performed in the presence of 5 μM ionomycin. NO recordings were performed using C-geNOp. (B) Bars represent respective statistics of panel A, maximum initial slope of nNOS- (green bar, n = 34/3) and eNOS-derived (blue bar, n = 36/3) NO signals. Mean values are shown ±SD, *P < 0.05 versus control using unpaired t-test. (For interpretation of the references to colour in this figure legend, the reader is referred to the web version of this article.)

