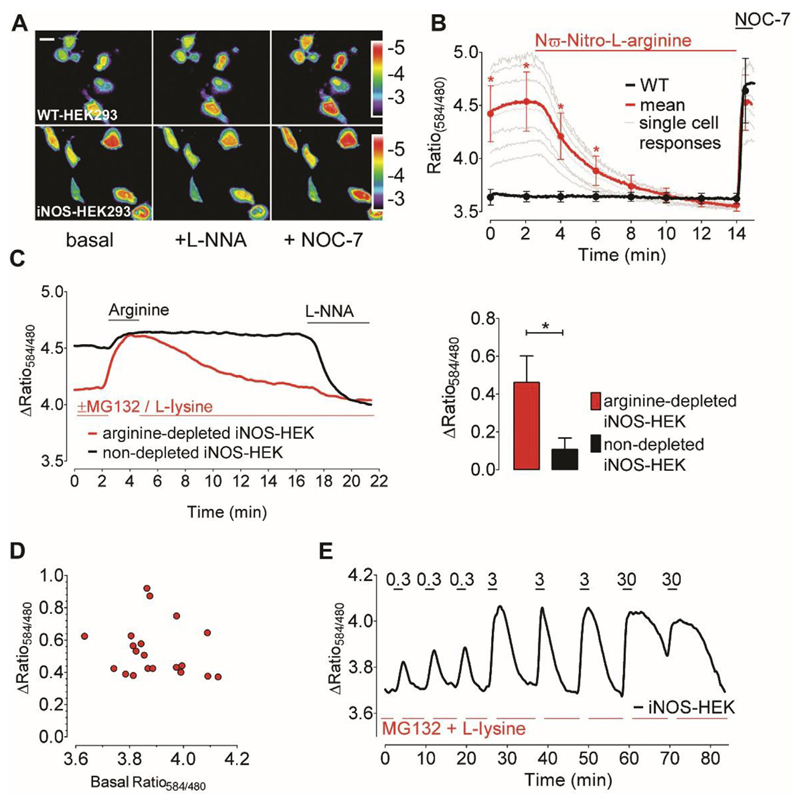
Fig. 7. Visualizing of NO dynamics in iNOS-expressing cells.
(A) Representative pseudo-colored ratio images (F584/F480) of CR-geNOp-transfected wild-type (upper images) and iNOS-expressing HEK293 cells (lower images) under initial conditions (left panel) and in the presence of 500 μM L-NNA (middle panel) or 10 μM NOC-7 (right panel). Scale bar represents 10 μm. (B) Mean curves (bold line) and single cell traces (thin lines) showing NO signals of stably iNOS-expressing (red bold curve, n = 23/3) and wild-type HEK293 cells (black bold curve, n = 15/3). Cells were treated with 300 μM L-NNA followed by administration of 10 μM NOC-7. (C) Representative time course showing NO signals in arginine-depleted (red curve) versus non-depleted iNOS-expressing HEK293 cells (black curve). Cells were treated with 50 μM L-arginine and 500 μM L-NNA as indicated. Bars represent respective statistics from panel C. Maximal ratio changes of arginine depleted iNOS-expressing (red bar, n = 21/3) and non-depleted iNOS HEK293 cells (black bar, n = 7/3) upon 50 μM L-arginine supplementation. Mean values are shown in ±SD, *P < 0.05 versus control using unpaired t-test. (D) Correlation of maximal arginine-induced ratio changes (y-axis) with respective basal ratio values (x-axis) of arginine-depleted iNOS-expressing HEK293 cells. (E) Representative time course showing cellular NO signals of an arginine-depleted (using MG132 and L-lysine) iNOS-HEK cell in response to increasing concentrations of arginine (0.3 μM, 3 μM and 30 μM). Arginine was added transiently and repetitively as indicated. (For interpretation of the references to colour in this figure legend, the reader is referred to the web version of this article.)

