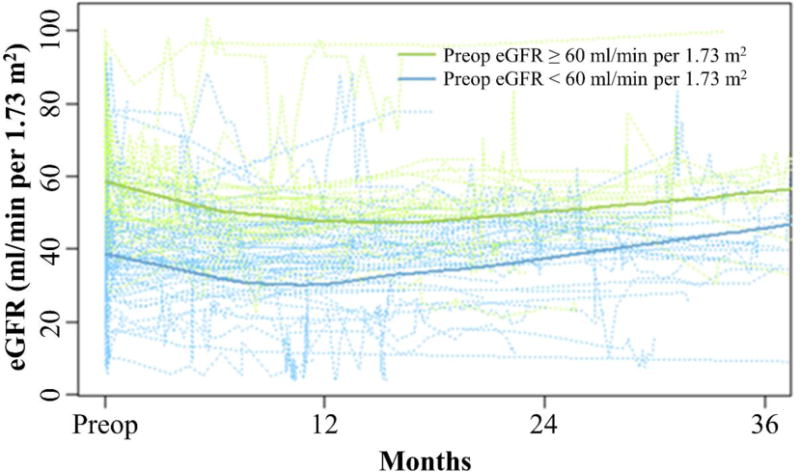
Figure 1. Longitudinal trends of eGFR values after radical nephroureterectomy.

Individual patient trajectories of postoperative eGFR were plotted for patients with preoperative eGFR ≥ 60 ml/min per 1.73 m2 (green dotted lines) and patients with postoperative eGFR < 60 ml/min per 1.73 m2 (blue dotted lines). Locally weighted scatterplot smooths by preoperative eGFR are shown with solid lines.
