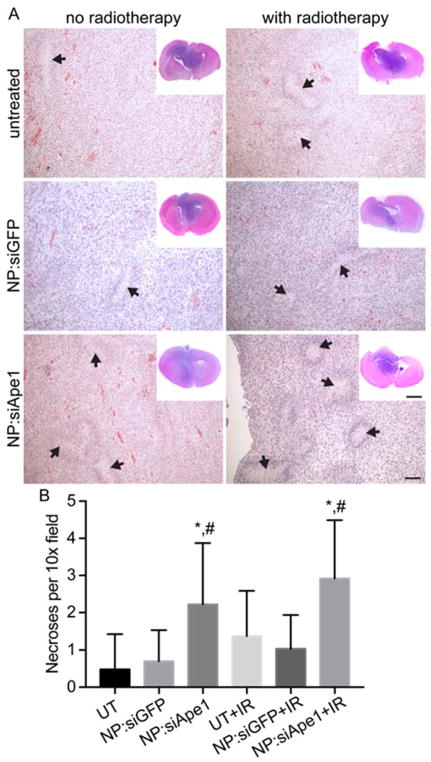
Figure 5.
Histological analysis of brain tumors. A) Hematoxylin and Eosin stained brain sections showing necrotic regions (black arrows). Scale bars are 100 μm for 10x images and 250 μm for whole brain insets. B) Quantification of necrotic regions from 3 10x field views per slice, 3 slices per mouse, 3 mice per treatment condition. * indicates statistical difference (p < 0.01) as compared to UT or UT+IR within the same group, # indicates statistical difference (p < 0.01) as compared to NP:siGFP or NP:siGFP+IR within the same group.

