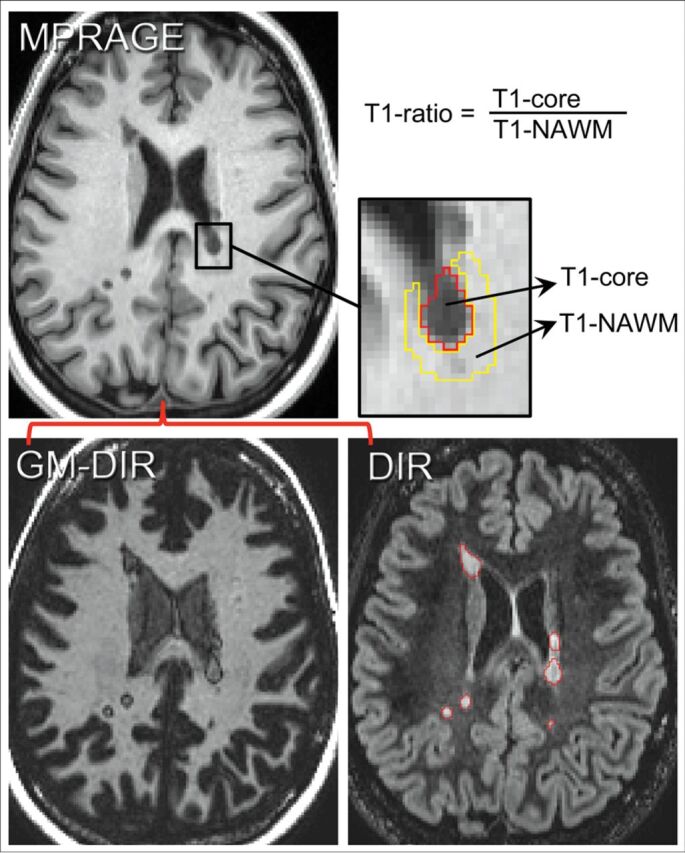
Fig 1.

Method for determining the T1 ratio. First GM-DIR and DIR images are coregistered to the MPRAGE images. Next, lesions are manually segmented on DIR images (red lines surround individual lesions). The signal intensity within the lesion (T1 core) and outside of the lesion (T1 normal-appearing WM) is measured, and the T1 ratio is computed from those intensity values as shown.
