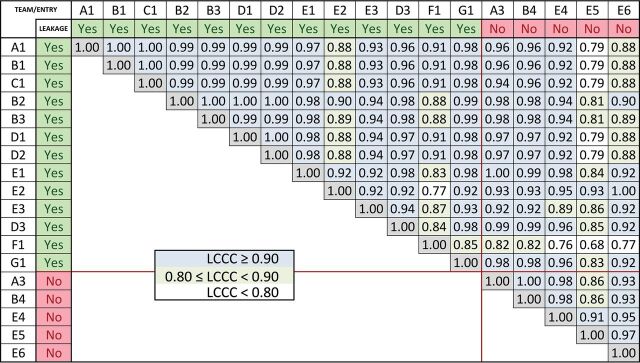
Fig 3.
Lin concordance results for nRCBV. Listed are the Lin concordance correlation coefficients for the nRCBV values for each pair of sites. Whether leakage correction was applied is indicated by green labels, with red labels indicating no leakage correction. Pairs with excellent concordance (LCCC > 0.90) are highlighted with blue-filled squares; very good concordance (0.80 < LCCC < 0.90), with green squares; and weaker concordance (LCCC < 0.80), with white squares.

