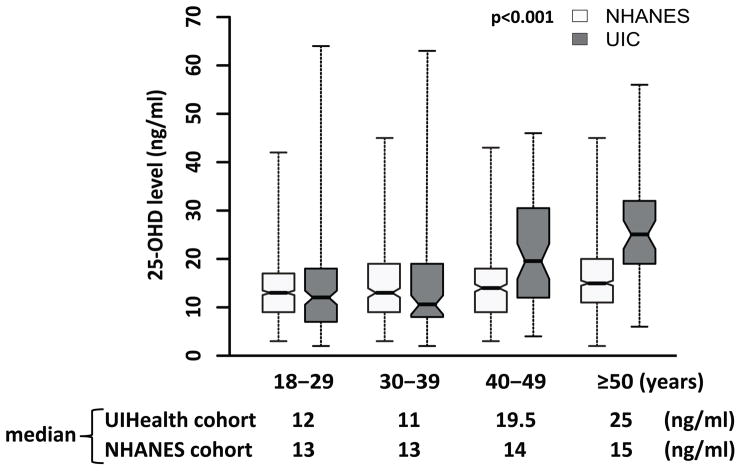
Figure 1. The 25-OHD Levels in Different Age Groups.
The 25-OHD levels among different age groups were compared using the Kruskal–Wallis test and the Conover-Inman Test for All Pairwise Comparisons. Cruzik’s test was used to estimate the trend of 25-OHD levels across age groups of ≤29, 30–39, 40–49, and ≥50 years for both the University of Illinois at Chicago (UIC) cohort and National Health and Nutrition Examination Survey (NHANES) cohort. To test the differential effect of older age (≥40 years) on 25-OHD levels between sickle cell disease patients and normal individuals, log-transformed 25-OHD levels were regressed on age category, disease status and their interaction effect. The boxes denote the inter-quartile range and the whiskers denote the range of the data.

