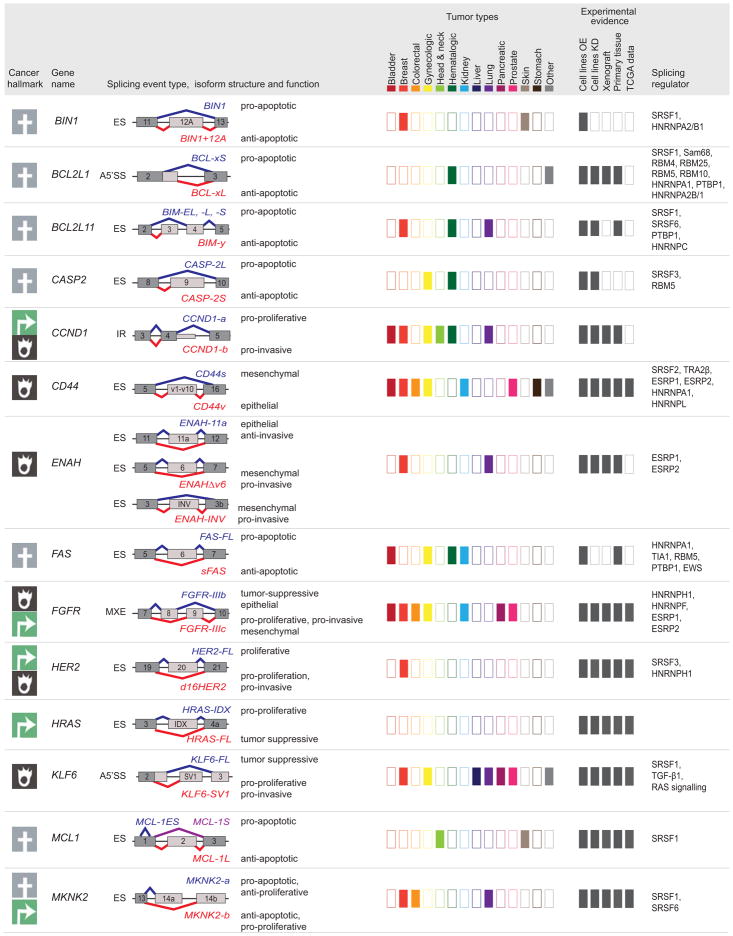
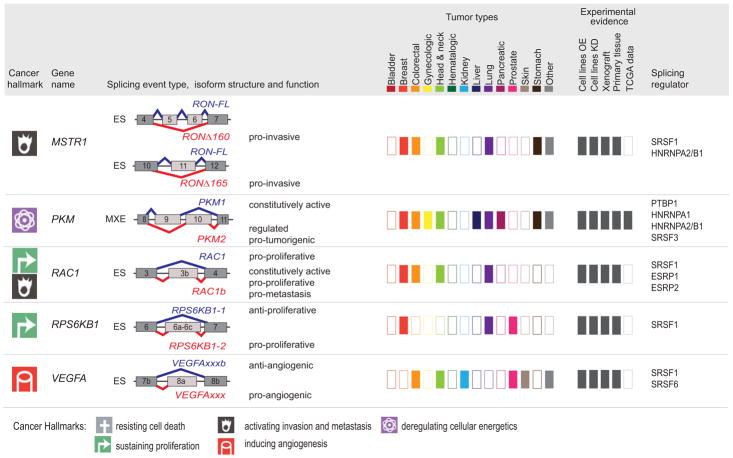
Figure 5. Tumor-associated isoforms representative of the cancer hallmarks.
Splicing event type, isoform structure, tumor expression, and experimental evidence for selected alternative splicing isoforms detected in human tumors. For simplicity, only the alternatively spliced sequences and the flanking exons and are shown (not at scale). The type of splicing event is indicated: ES: exon skipping; MXE: mutually exclusive exons; 5′ASS: 5′ alternative splice site selection; IR: intron retention. The corresponding isoforms are shown in red or blue and their respective functions are indicated when known, to the right of the schematic figure of the isoform. The cancer hallmark associated with the red isoform is indicated in the left-hand column (See legend for details). ‘Tumor types,’ indicates, using dark-colored rectangles, the expression of tumor-associated isoforms in each of the indicated tumor types (‘other tumors’ include: adrenal, gallbladder, ampullary, bone, and brain; ‘gynecological tumors’ include: ovarian, cervical, and uterine; ‘head and neck’ tumors include: oral, head and neck, tongue, esophageal, and thyroid). ‘Experimental evidence’ indicates, using dark gray rectangles, the expression and functional evidence for each isoform based the following experiments: (i) overexpression (OE) or knockdown (KD) in cell lines, (ii) tumor xenografts, (iii) expression in primary tissue, or (iv) expression in TCGA RNA-sequencing data. Known splicing regulatory proteins are listed for each gene. See text for references.


