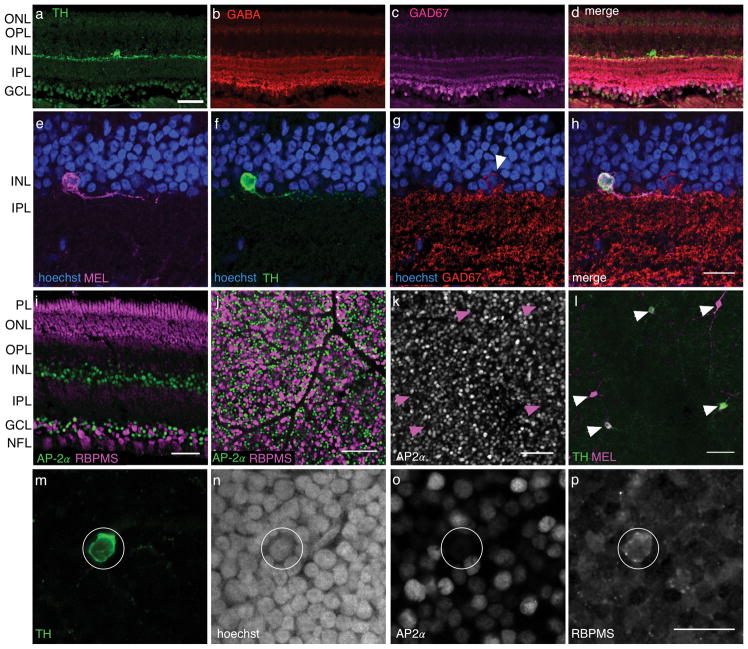
Figure 6.
TH+ cells immunolabel for RGC marker and not amacrine markers. (a) TH+ positive cell in cross section. Scale bar: 50 μm. (b–d) Same field of view as (a), but showing immunolabeling for GABA, GAD67 and a merge of all three channels, respectively. (e–h) MEL+ cell (e) that is also TH+ (f), but GAD67 negative (g), and a merge of all three labels with hoechst (h). Arrowhead in (g) indicates neighboring GAD67+ cell. Scale bar, 20 μm. (i) Comparison of labeling patterns for amacrine cell marker AP-2α and RBPMS in a transverse retinal slice. Scale bar: 50 μm. J. Comparison of labeling patterns for amacrine cell marker AP-2α and RBPMS in retinal whole mount, focused on the GCL. Scale bar: 100 μm. (k–l) AP-2α and TH labeling of the INL, respectively. Arrowheads indicate locations of TH+ cells in both images. (m–p) Example cell TH+ cell (m), showing hoechst labeling (n), and immunoreactivity for AP-2α (o) and RBPMS (p). Scale bar: 20 μm.

