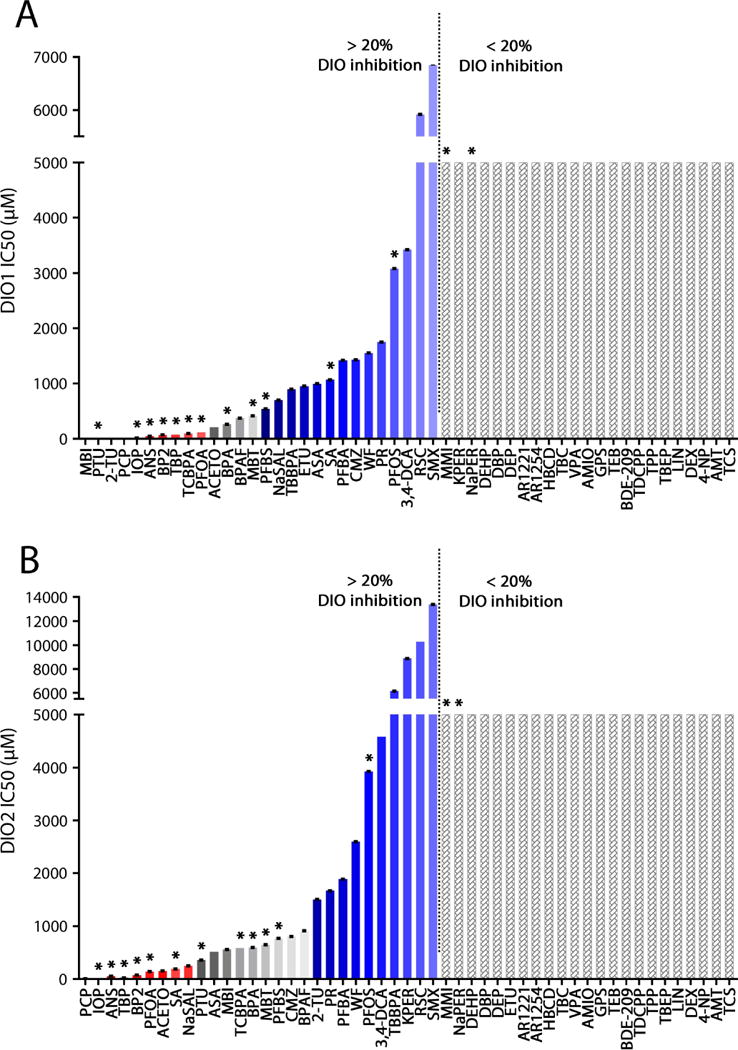
Figure 2.

Mean IC50 values for DIO1 (A) and DIO2 (B) inhibition of 51 compounds (n=3). An estimate of 5000 μM is given for compounds which did not exceed the 20% inhibition threshold relative to the negative control. Red bars indicate strong DIO inhibitors that are likely to act as TH disruptors (although false positives can occur), and blue bars indicate weak DIO inhibitors unlikely to act as TH disruptors (although false negatives can occur). The zone in gray indicates the current uncertainty in defining biological effect thresholds: given the existing data, it is difficult to assess the likelihood for compounds in this zone to act as thyroid disruptors. See also Figure 4. * indicates compounds tested in in vivo zebrafish acute toxicity tests. Error bars indicate standard errors.
