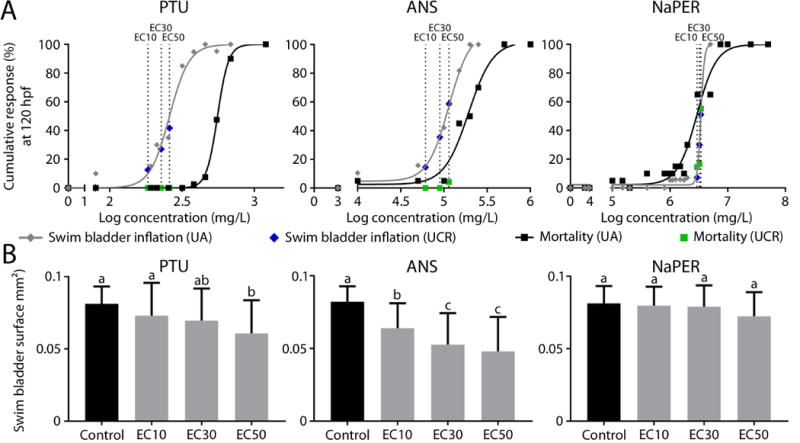
Figure 3.

A. Concentration-response curves for mortality and percentage impaired posterior chamber inflation at 120 hpf (three concentrations per compound, at least 40 embryos per condition). Black squares and gray diamonds, associated with black and gray concentration-response curves, represent effects on mortality and posterior chamber inflation respectively after performing experiments at UA (data at 120 hpf in order to compare results with data obtained at UCR). EC10, EC30 and EC50 concentrations (dotted lines) were calculated based on these data and used to perform exposures at UCR. Green squares and blue diamonds represent effects on mortality and posterior chamber inflation respectively after performing experiments at UCR. Although zebrafish with different genetic backgrounds were used in the two laboratories, we observed a high similarity between labs for the frequencies of impaired posterior inflation and mortality. B. Mean posterior surface area at 120 hpf after exposure to 3 potentially thyroid disrupting compounds at UCR. Error bars indicate standard deviations. Different letters indicate a significant effect between the different groups (p<0.05).
