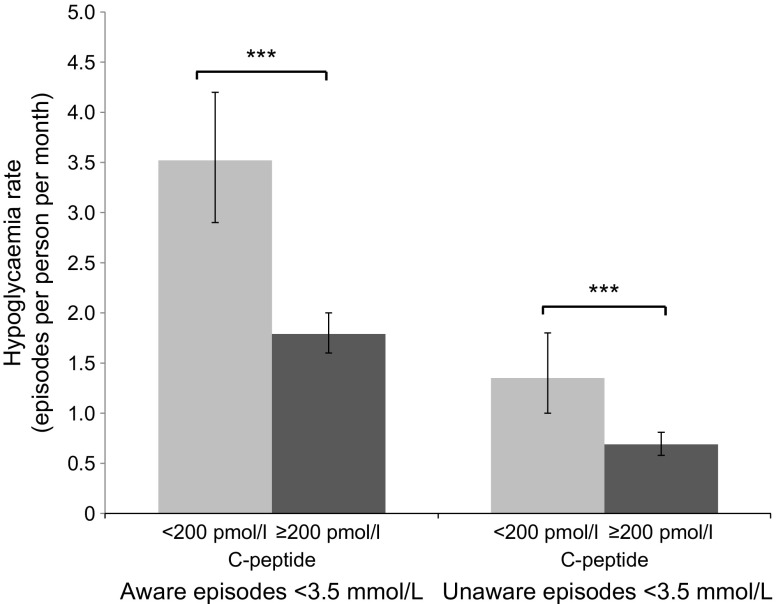
Fig. 2.
Frequency of self-reported hypoglycaemia (< 3.5 mmol/l) by C-peptide status in patients with insulin-treated type 2 diabetes (n=256). Light grey bars, rCP < 200 pmol/l; dark grey bars, rCP ≥ 200 pmol/l. Rates of aware and unaware episodes derived from Clarke questions 5 and 6, respectively. Error bars represent 95% CI. ***p<0.001 for rCP < 200 pmol/l vs ≥ 200 pmol/l

