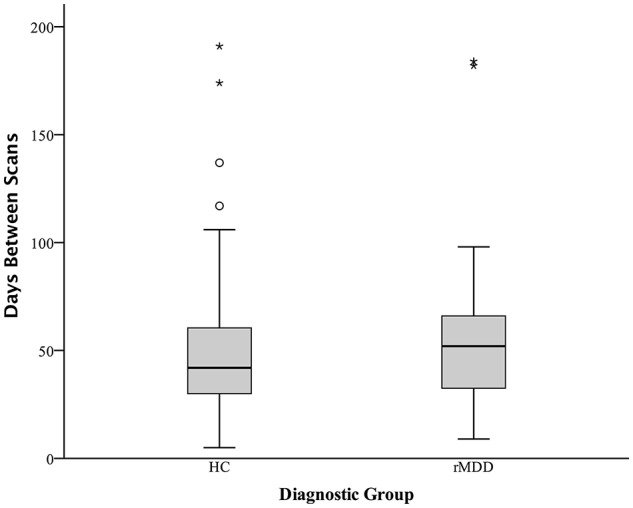
Figure 2.

Days Between fMRI Scans Boxplot Separated by Diagnostic Group. Boxplots of number of days between two fMRI scan sessions for healthy control and remitted major depressive disorder participants. Dark colored line represents the median, open circles are outliers and asterisks represent significant outliers. There were a total of 4 outliers for healthy controls and 2 outliers for remitted MDD individuals.
