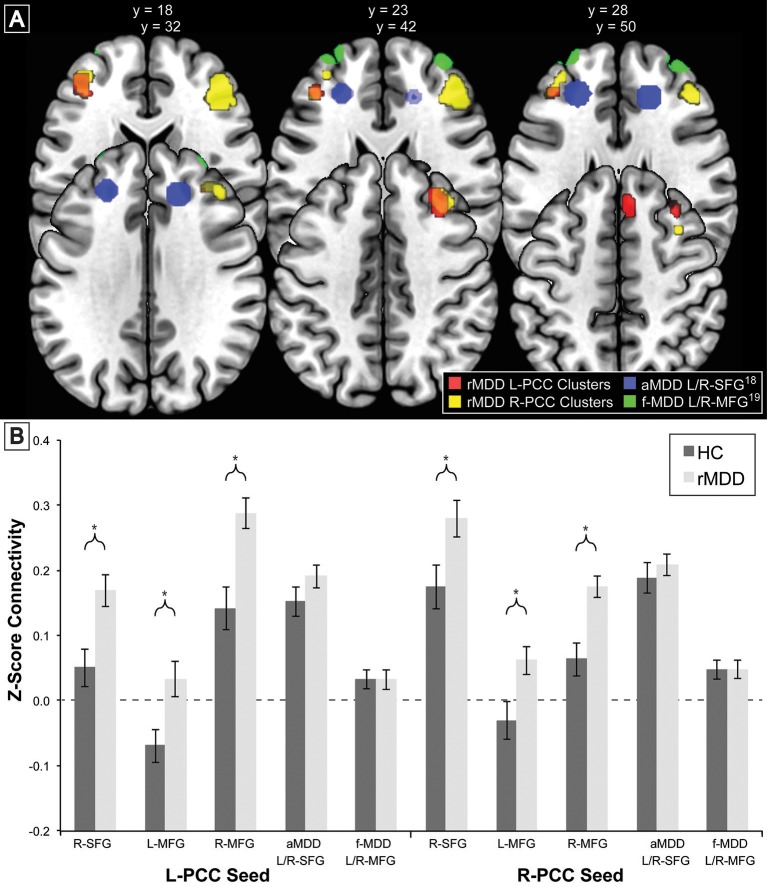
Figure 3.
Comparison of Prefrontal Cortex Clusters with Active and Familial Risk for Depression. Comparison of 3 left PCC seed rMDD-different connectivity clusters (red), 3 right PCC seed rMDD-different connectivity clusters (yellow), bilateral SFG connectivity from precuneus seed (also showing connectivity with our PCC seed) found in active depression (18) (blue) and bilateral MFG connectivity from PCC found in familial-risk for depression (19) (green). (A) Axial view of each significant cluster and ROIs with 8 mm radius found in studies of active and familial-risk for depression. (B) t-test comparisons of mean connectivity in first scan from bilateral PCC to prefrontal cortex clusters found in the current study, combined left and right active depression SFG, and combined left and right familial-risk depression MFG. Bars represent ±1 standard error from the mean. *Significantly different between groups (p < 0.005, k > 57). aMDD, active major depressive disorder; f-MDD, familial-risk for major depressive disorder.

