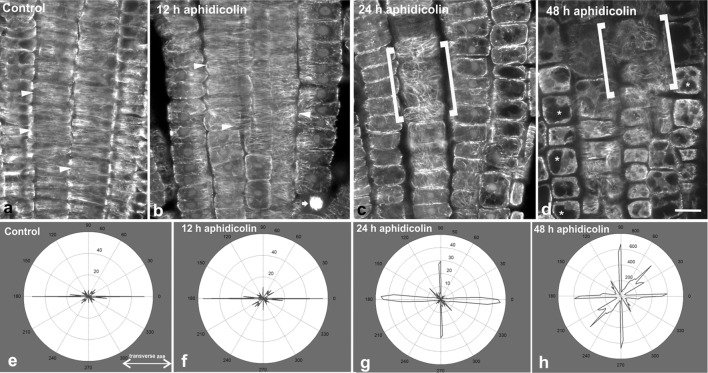
Fig. 1.
Cortical microtubule orientation in the meristematic zone of untreated (a) and aphidicolin-treated (b–d) roots. Single CLSM sections through the boundary between protoderm and cortex are presented, so that in the center of each figure cortex cells can be observed. In all the images of this work the root tip is oriented towards the bottom of the page. In control root (a) prominent transverse orientation of cortical microtubules can be observed in interphase cells (arrowheads). At 12 h of treatment (b) transverse microtubule orientation persists (arrowheads), while dividing cells still exist (arrow points to a mitotic cell). After 24 h of treatment (c), cell divisions have ceased and cortical microtubules exhibit random orientation (cells within the brackets are cortex cells viewed at external cortical plane), which is also observed after 48 h of treatment (d; cells within brackets). In the latter image, vacuolation of meristematic cells in also prominent (asterisks show vacuoles). Representative decipher-graphs of microtubule alignment in meristematic cells of control (e), 12 h (f), 24 h (g) and 48 h (h) aphidicolin treatments. Decipher-graphs show that microtubules are transversely oriented (doubled-headed arrow) in the control and after 12 h of aphidicolin treatment (e, f), while the frequency of longitudinal and randomly oriented microtubules increased upon prolonged treatments (g, h, respectively). Scale bar 10 μm

