Fig. 3.
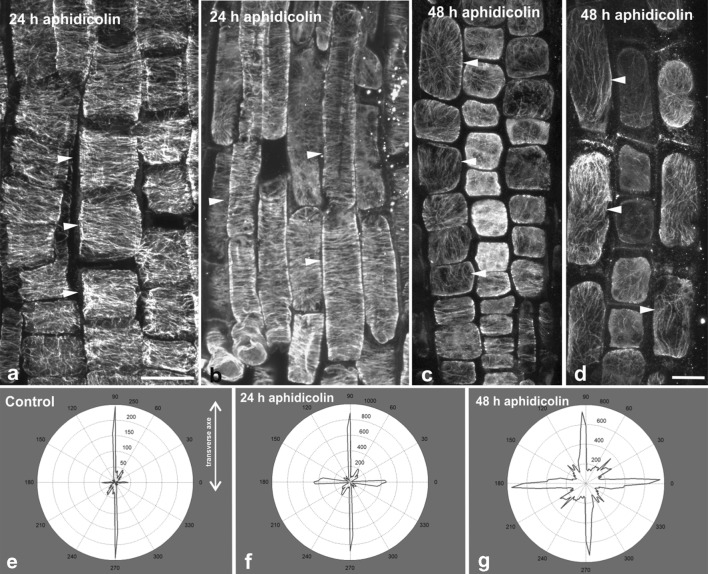
Cortical microtubule orientation at the external face of epidermal cells in the transition (i.e. under the shootward part of the lateral root cap; a, c) and fast elongation (b, d) zones of aphidicolin-treated roots. All images are maximum projections of serial CLSM sections. After 24 h of treatment, microtubules are transverse (arrowheads) in the transition (a) and fast elongation (b) zone, while after 48 h of treatment they appear randomly oriented in both zones (c, d). Representative decipher-graphs of microtubule alignment in transition and elongation zone cells of control roots (e), and after 24 h (f) and 48 h (g) of aphidicolin treatment. Decipher-graphs show that microtubules are transversely oriented (doubled-headed arrow) in the control and after 24 h of aphidicolin treatment (e and f, respectively), while the frequency of longitudinal and/or randomly oriented microtubules increased after 48 h of treatment (g). Scale bar 10 μm

