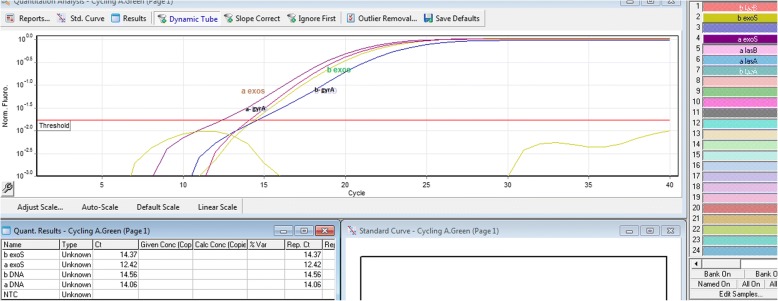
Fig. 1.
exoS gene amplification curve using Real-time RT-PCR technique: As outlined in the figure, the Ct level of the exoS gene was different before and after treatment (Ct before treatment = 14.32 and Ct after treatment = 12.42). However, there was no change in the Ct level of the fabD gene before and after treatment (Ct before treatment = 14.56 and Ct after treatment = 14.06). Therefore, the amount of the exoS gene expression changed after treatment, while the FabD gene expression had no change before and after treatment

