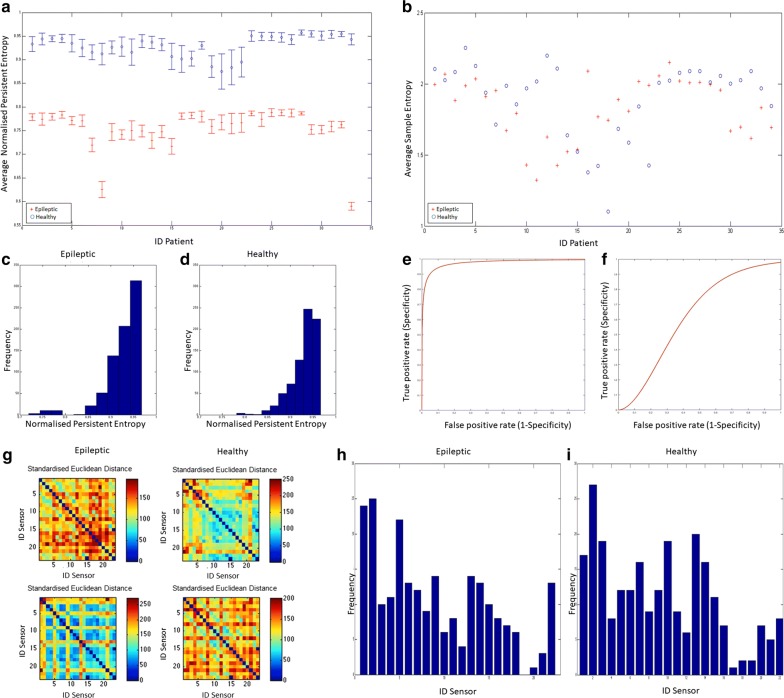
Fig. 3.
a for epileptic (red) and healthy (blue) signals. b Average value of Sample Entropy over the 23 EEG signals of epileptic patients (red) and of healthy patients (blue). c, d Histogram of the frequencies of values for each channel, for each patient and for the two classes of patients. The elements are sorted into 10 equally spaced bins along the x-axis between the minimum and maximum values of . e The ROC curve of the -based classifier (AUC = ). f The ROC curve of the Sample Entropy-based classifier (AUC = ). g Mosaic Plots representing the distance matrices of the recordings of four patients. The entries of the matrices are the pairwise Standardised Euclidean distances among sensors. The matrices are used in the calculation of Vietoris–Rips filtration. h, i Frequency of the generators, i.e. sensors, belonging to the found i-dimensional holes for 33 epileptic signals (left) and 33 healthy signals (right)

