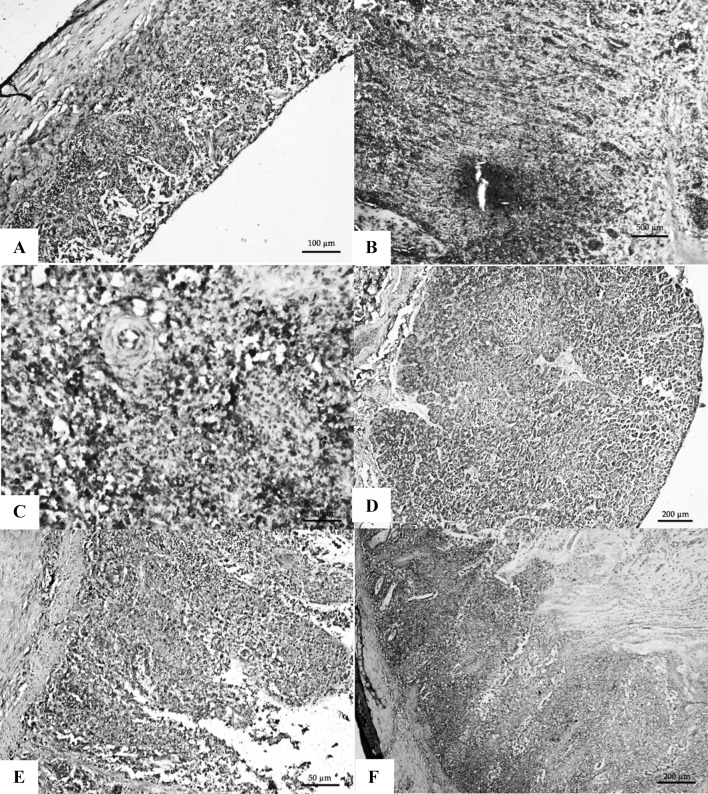
Fig. 3.
a Trachea with strong positive signals from the necrotic mucosa, sub-mucosa and inflammatory cells. IHC 20×; b Proventriculus showing strong positive signals from the necrotic mucosa and inflammatory cells IHC 40×; c Spleen showing strong positive signals in the RE cells and macrophages from the areas surrounding the central arteriole in the PALS area IHC 40×; d Pancreas with strong positive signals from the necrotic areas. IHC 10×; e Duodenum showing strong positive signals from the inflammatory cells in the lamina propria and sub-mucosa IHC 40×; f Caecal tonsil with strong positive signals from lymphocytes and other inflammatory cells in the sub-mucosa. H&E 20×

