
Fig. 7.
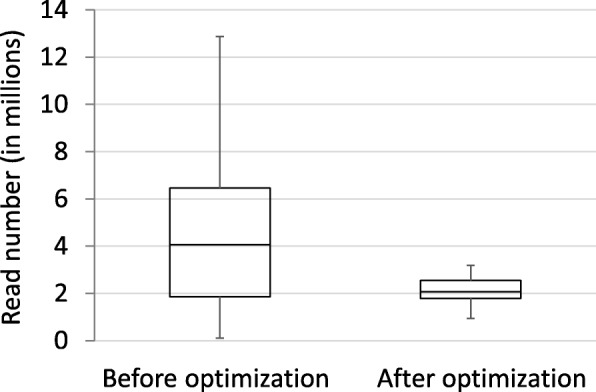
Box-and-whisker plot showing the read number distribution across pooled samples before optimization and after optimization of the GBS protocol
Official websites use .gov
A
.gov website belongs to an official
government organization in the United States.
Secure .gov websites use HTTPS
A lock (
) or https:// means you've safely
connected to the .gov website. Share sensitive
information only on official, secure websites.
Box-and-whisker plot showing the read number distribution across pooled samples before optimization and after optimization of the GBS protocol