Figure 2.

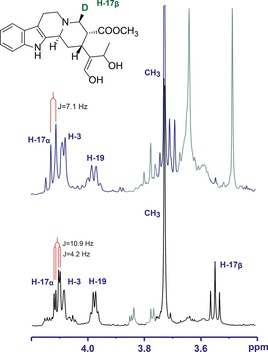
NMR spectra of deuterated product of VAS (Cro013448) (top) in comparison with non‐deuterated product (bottom). Signals from contaminants are coloured in grey.

NMR spectra of deuterated product of VAS (Cro013448) (top) in comparison with non‐deuterated product (bottom). Signals from contaminants are coloured in grey.