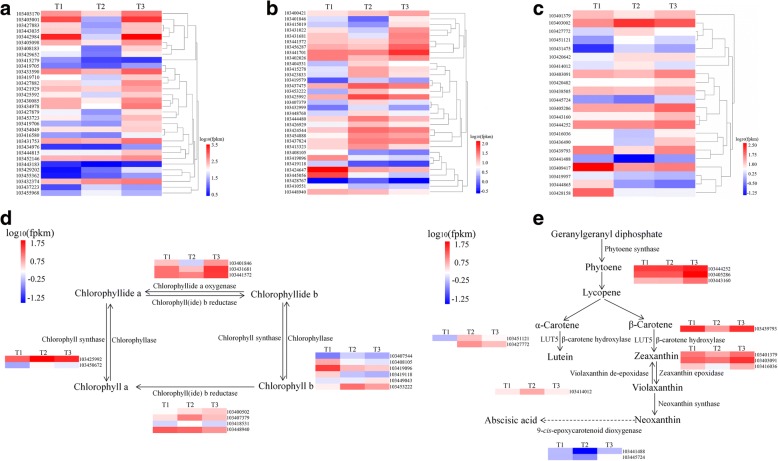
Fig. 4.
a Heat map analysis showing the gene expression patterns involved in photosynthesis-antenna protein pathway during the iron-deficiency process. b Heat map analysis showing the gene expression patterns involved in porphyrin and chlorophyll metabolism pathway during the iron-deficient-process. c Heat map analysis showing the gene expression patterns involved in carotenoid biosynthesis pathway during the iron-deficiency process. d Partial porphyrin and chlorophyll metabolism pathway that differentially expressed genes involved in during the iron-deficiency process. e Partial carotenoid biosynthesis pathway that differentially expressed genes involved in during the iron-deficiency process. Each gene at each of the three timepoints was represented as a horizontal short line

