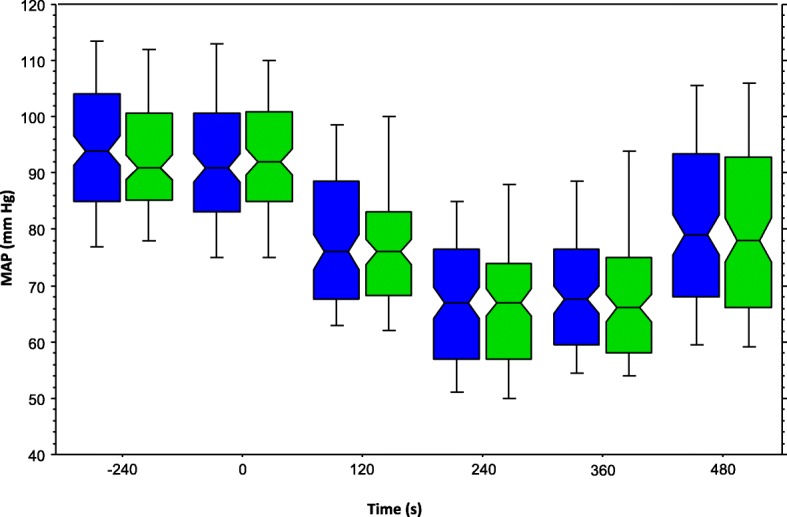
Fig. 3.

Mean arterial pressure over time. Legend: Box-plot of mean arterial pressures of BIS group (blue) and NON-BIS group (green) during the study period. While the bottom and the top of the box represent the first and third quartile, whiskers represent the 10th and the 90th percentile. The line in the middle of the box indicates the median and the notches of the box show the 95% confidence interval of the median
