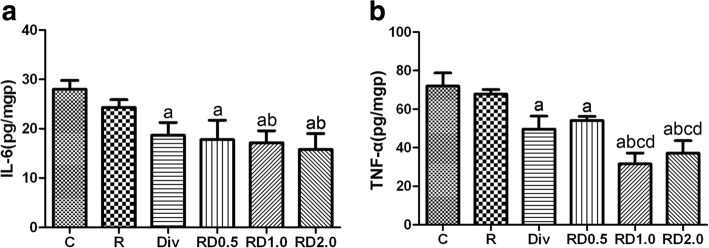
Fig. 3.
Examination of IL-6 and TNF-α by ELISA following one-lung ventilation. Figure 2a: TNF-α and IL-6 content was lower in the Div, RD0.5, RD1.0 and RD2.0 groups than in the C group; TNF-α and IL-6 content was lower in the RD1.0 and RD2.0 group than in the R group; TNF-α content was lower in the RD1.0 and RD2.0 groups than in the Div and RD0.5 groups; aP<0.05 vs. the C group; bP<0.05 vs. the R group; cP<0.05 vs. the Div group; dP<0.05 vs. the RD0.5 group. C, normal saline; R, ropivacaine; Div, intravenous DEX; RD0.5, 0.5 μg/kg DEX as an adjuvant to ropivacaine TPVB; RD1.0, 1.0 μg/kg DEX as an adjuvant to ropivacaine TPVB; RD2.0, 2.0 μg/kg DEX as an adjuvant to ropivacaine TPVB

