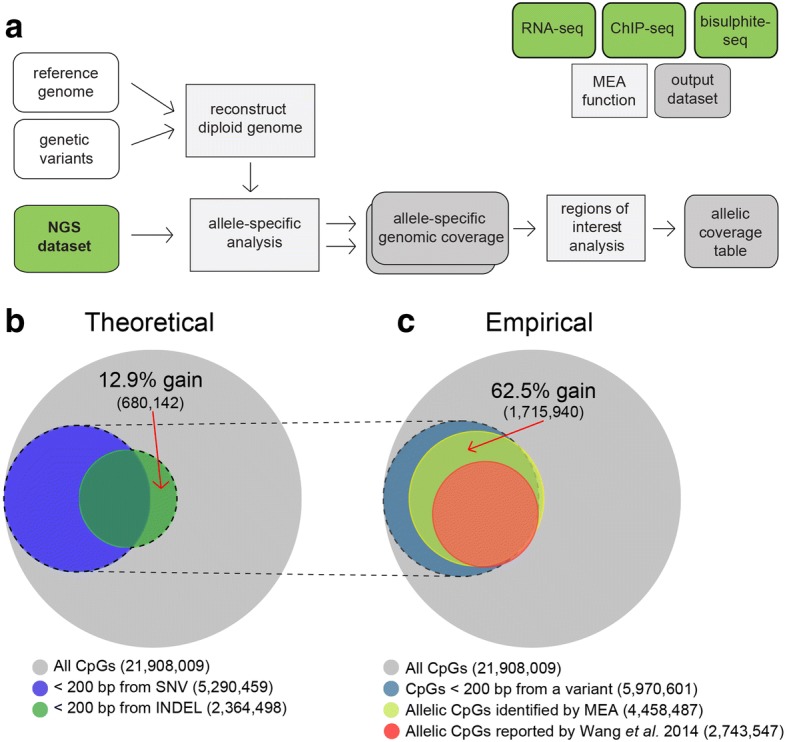
Fig. 1.

A bioinformatics toolkit for allele-specific epigenomic analysis. a MEA pipeline flow chart. Supplied with a reference genome assembly and relevant genetic variants, MEA first reconstructs a diploid pseudogenome. Subsequently, allele-specific analysis is performed on the input gene expression (RNA-seq), histone PTM (ChIP-seq) or DNAme (WGBS) data in FASTQ format. MEA calculates allelic imbalance values using the resulting allele-specific genomic coverage files and generates a tab-delimited table for the user-defined regions of interest. Mouse and human exon, gene body and transcription start site coordinates are provided to facilitate analyses of such regions. b Venn diagram showing the theoretical number of CpG dinucleotides for which allele-specific DNAme levels can be calculated using C57BL/6 J and DBA/2 J SNVs (blue) or INDELs (green) alone. CpGs for which allelic information can theoretically be extracted are defined as those that fall within 200 bp (an insert size typical of WGBS libraries) of a genetic variant. c Venn diagram showing the observed number of C57BL/6 J-specific CpG dinucleotides for which allele-specific DNAme levels were calculated using MEA (yellow) versus an INDEL-agnostic contemporary allele-specific DNAme script [11] using the same dataset (red)
