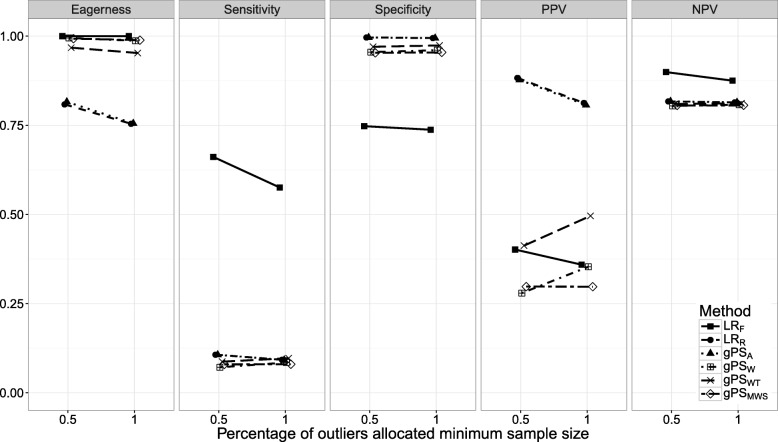
Fig. 7.
The eagerness, sensitivity, specificity, positive predictive value (PPV), and negative predictive value (NPV) for different percentages of outliers being allocated the minimum sample size, P(nmin), when using different risk adjustment methods. All other parameters were fixed (see scenario 7 of Table 1)

