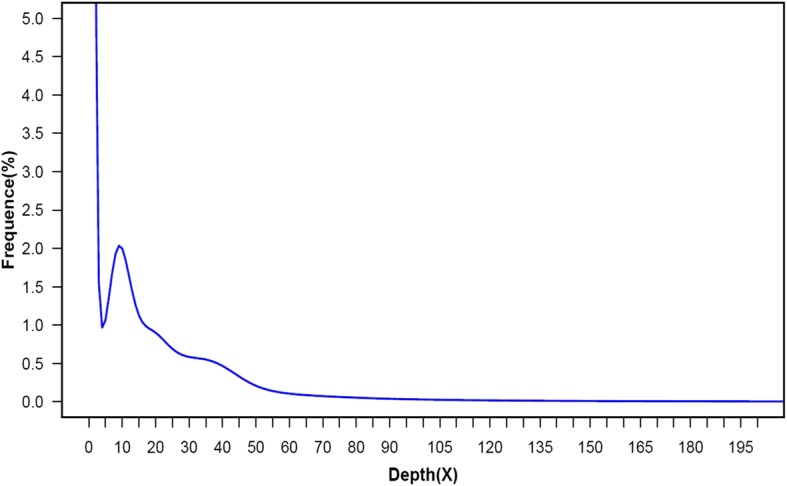
Fig. 1.

Kmer-17 depth distribution curve of the Rosa × hybrida genome sequence. A K-mer frequency distribution curve (k-mer = 17) using paired-ends with a 400 bp insert size is shown in the chart. The highest peak is located at a multiplicity of 9 (marked by the asterisk), and the estimated genome size based on the highest peak is 2.3 Gb
