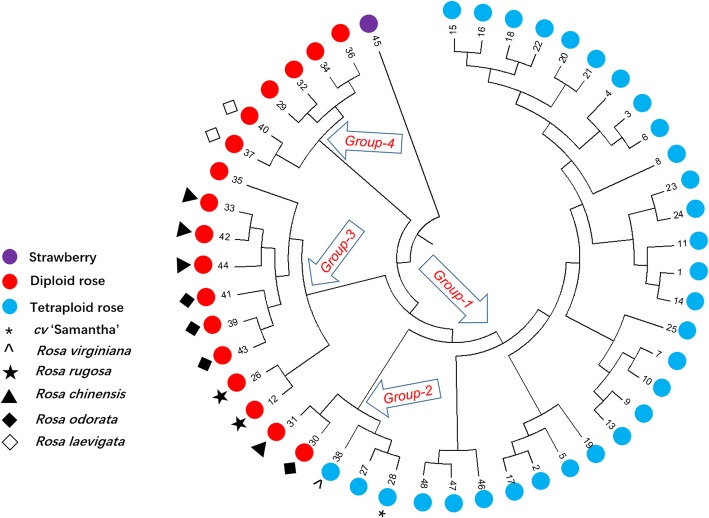
Fig. 5.
Tree plot of genetic diversity based on PCR results using 37 SSR markers. Tree plot derived from UPGMA cluster analysis using the NEI72 coefficients of SSR markers. The UPGMA (unweighted pair group method analysis) tree plot was generated using Mega 7.0 cluster analysis based on the genetic distances (calculated using NEI72 coefficients with NTSYS software) of 48 independent accessions. Blue circles = tetraploid rose accessions; red circles = diploid accession; purple circles = strawberry accession. The accession codes are marked, and the names can be found in Table 3. * = cultivar ‘Samantha’

