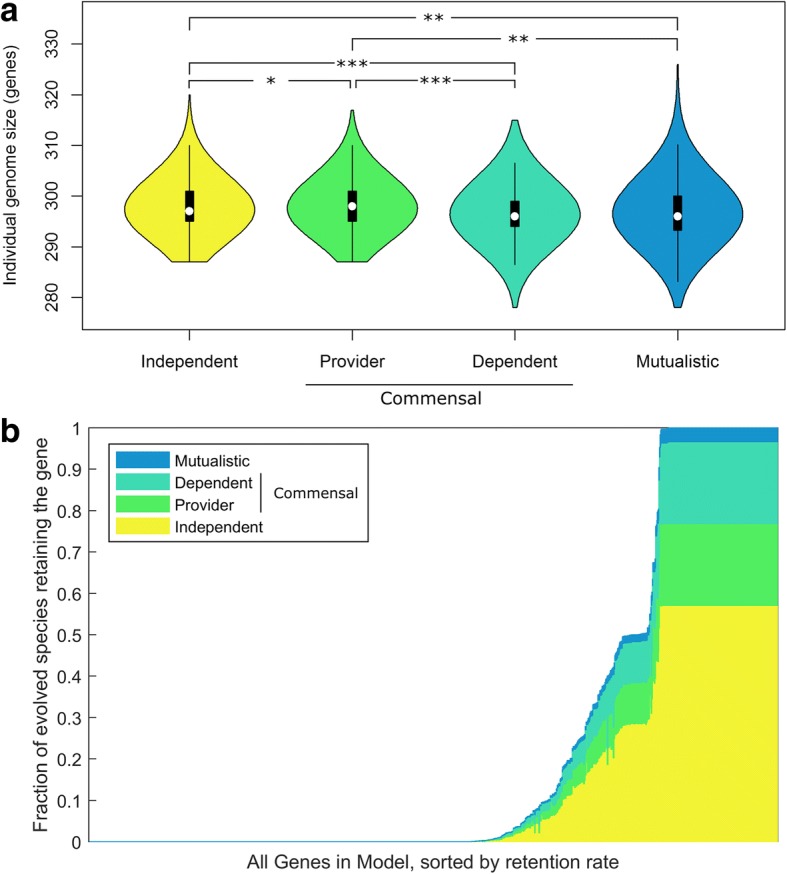
Fig. 4.

Genome size and gene retention frequency in evolved genomes. a Distributions of the genome size of evolved species from each interaction type. (*: P < 10− 3; **: P < 10− 9; ***: P < 10− 30). b The distribution of retention rates of different genes in the model. Each gene is plotted as a vertical bar with height equal to the fraction of species in non-collapsed simulations that retained it, and the genes are sorted in ascending order of this overall retention rate. Each bar is colored by the fraction of species retaining that gene that are in each of the different interaction types
