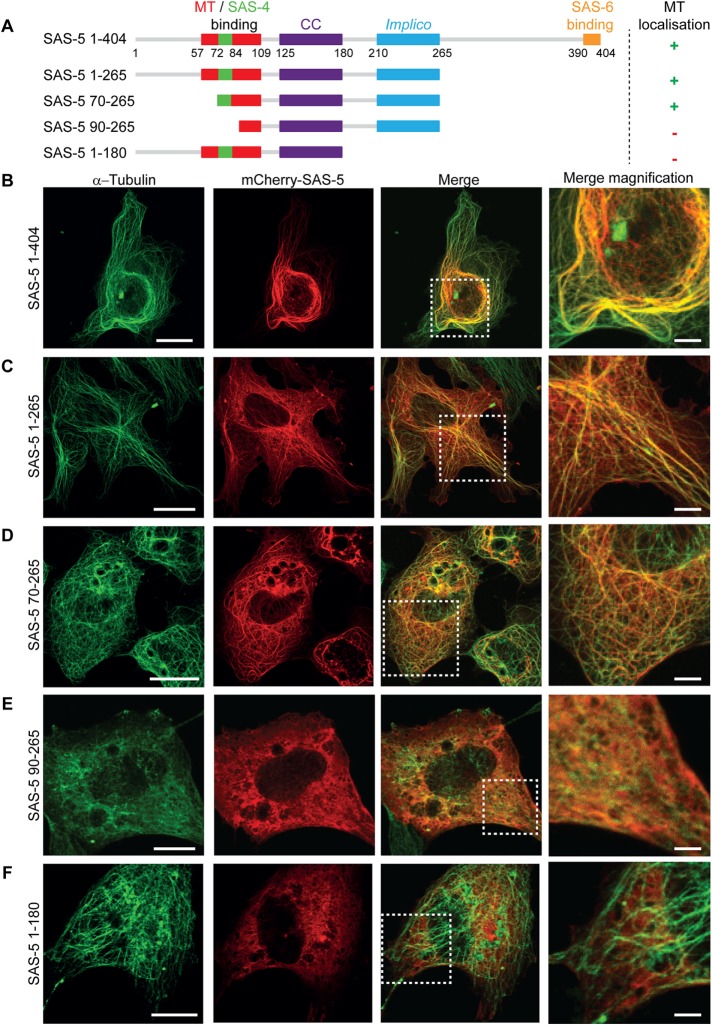
FIGURE 2:
SAS-5 colocalizes with microtubules in mammalian cells. (A) Schematic representation of SAS-5 constructs used in transfection assays, showing the coiled-coil and Implico oligomerization domains of SAS-5, as well as microtubule (MT)-, SAS-4-, and SAS-6-interaction regions. Note that the SAS-4 and microtubule-binding sites partly overlap. The microtubule localization in COS-7 cells of each construct is indicated on the right. (B–F) Representative fluorescence images of COS-7 cells transiently expressing mCherry-SAS-5 full length (B) or truncations as indicated (C–F). Microtubules were visualized using immunofluorescence with α-tubulin antibodies; SAS-5 was visualized by mCherry fluorescence. Scale bar, 20 μm. The rightmost column corresponds to digital magnification of boxed areas in merged images. Scale bar, 5 μm in magnified images. Assays were performed once. The diffused microtubule fluorescence in cells expressing mCherry-SAS-5 90–265 (E) was seen throughout this particular transfection but not in parallel transfections of HEK293T cells (Supplemental Figure S1E), indicating that such diffused appearance is not a property of the SAS-5 construct but a transfection artifact.

