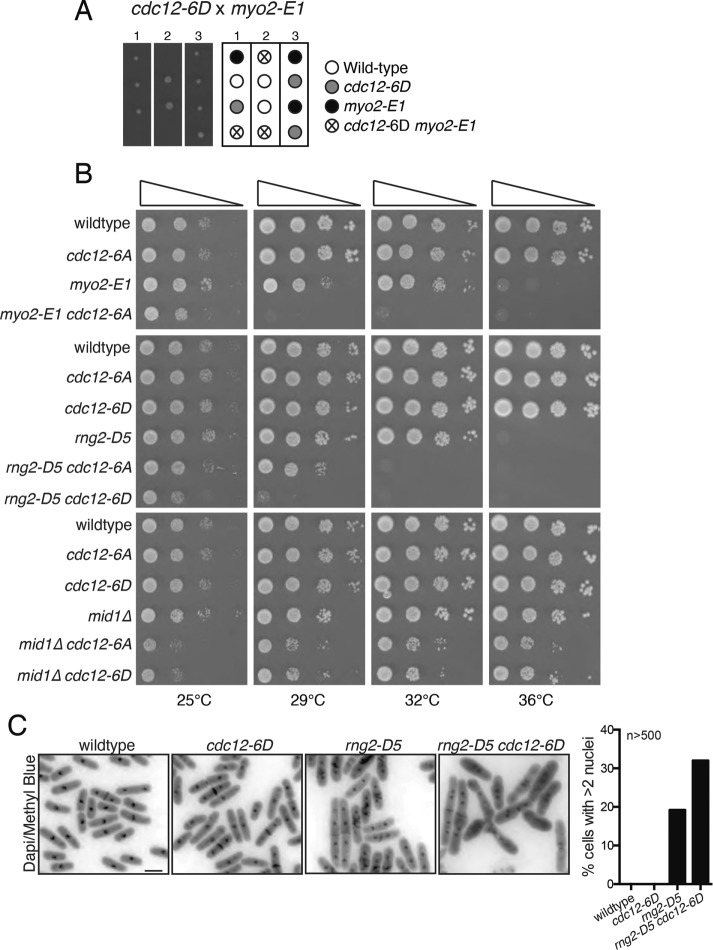
FIGURE 2:
Genetic interactions of cdc12-6A and cdc12-6D. (A) Tetrads from cdc12-6D crossed to myo2-E1 shown with a schematic of relevant genotypes. (B) Cells of the indicated genotypes were spotted on YE media in 10-fold serial dilution, and plates were imaged after incubation for 3 d at the indicated temperatures. (C) The indicated strains were grown at 25°C and shifted to 36°C for 4 h before fixing and staining. Representative images are shown on the left and the percentage of cells with more than two nuclei is quantified on the right. n ≥ 500 for each strain. Bar, 5 μm.

