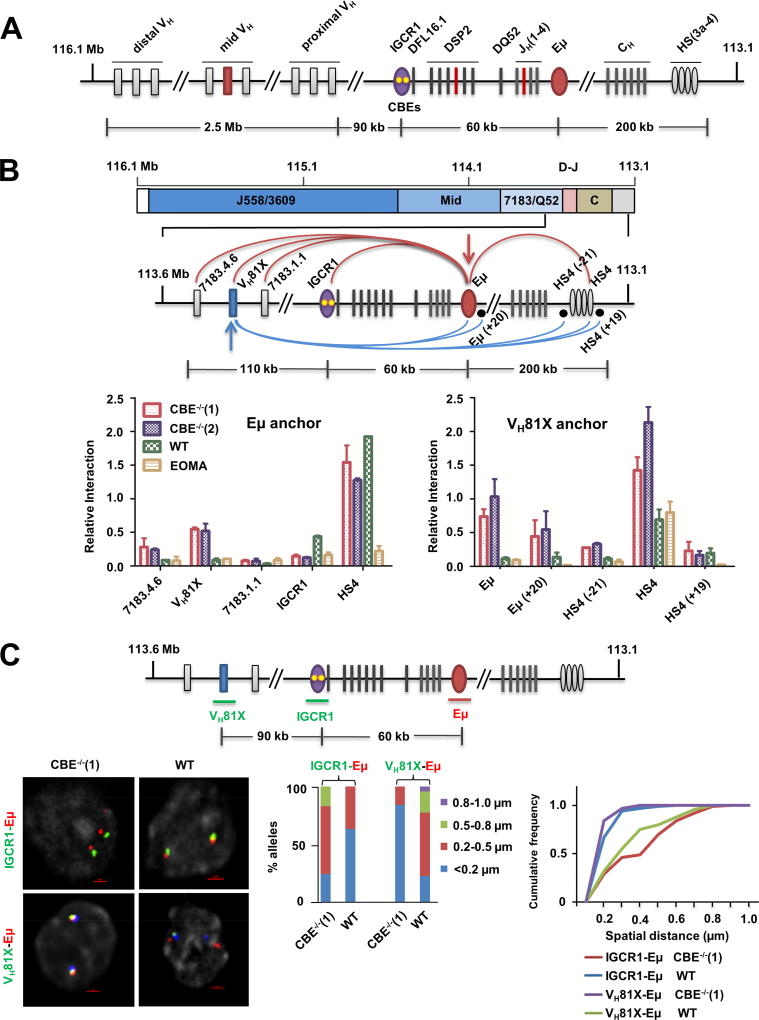
Figure 1. Altered looping of IGCR1-mutated IgH alleles.
A. Schematic representation of the murine germline (unrearranged) IgH locus. Variable gene segments (VH) occupy much of the locus starting at the 5’ end (left). VH gene segments are broadly categorized into three gene clusters: distal (comprising VHJ558 and VH3609 genes), mid (comprising several gene families) and proximal (comprising VH7183 and VHQ52 genes). A gap of 90 kb separates the 3’-most VH gene segments from the 5’-most diversity (DH) gene segment, DFL16.1. A family of closely-related DSP2 gene segments and a unique 3’ DQ52 gene segment spread over 60 kb complete the DH genes. Four joining gene segments (JH) are located within 1 kb 3’ of DQ52, followed by exons that encode the constant parts of antibody heavy chains (labeled CH). IgH gene assembly by recombination puts together one VH, one DH and one JH gene segment (highlighted in red) to encode the variable part of antibody heavy chains. Three key regulatory sequences are indicated as ovals. The IGCR1 is located just 5’ of DFL16.1 (purple; yellow dots represent 2 functional CTCF binding elements (CBEs)), the enhancer Eμ is located in the intron between JH gene segments and Cμ exons (red), and the 3’ regulatory region (HS3a-4) is a cluster of DNase1-hypersensitive sites located beyond the last CH exons (gray).
B. Chromosome conformation capture (3C) analyses of wild-type (WT) or IGCR1-mutated alleles in which both CBEs have been mutated. Pro-B cell lines carrying normal (WT) or IGCR1-mutated IgH alleles (CBE−/−(1) and CBE−/−(2)), and a non-B cell line of endothelial origin (EOMA), were subject to 3C analysis using anchor primers located at Eμ (left) or close to the 3’-most functional VH gene, VH81X (right). All pro-B cells were recombinase (RAG2) deficient to maintain IgH alleles in germline configuration. The region of interest is expanded below a scale view of the IgH locus (in which VH gene families are shown, the part marked D-J contains all DH and JH gene segments, and the part marked C contains all CH exons). Locations of anchor primers (arrows) and sites queried for interactions are indicated. Relative interaction frequency (Y axis) was calculated as described (Guo et al., 2011a) after normalization for ligation efficiency using α-amylase-specific primers. Amplification efficiency for different primer pairs was calculated based on restriction and re-ligation of 3 bacterial artificial chromosomes (BACs) that span the region of interest. Positions and sequences of primers are provided in Table S3. Data are shown as mean ± standard error of measurement (SEM) of two biological replicate 3C assays.
C. Fluorescent in situ hybridization (FISH) analyses of WT and IGCR1-mutated alleles. FISH was carried out as previously described (Guo et al., 2011a) using short probes located as shown in the schematic. Representative nuclei containing WT or IGCR1-mutated (CBE−/−(1)) alleles are shown; probes were color-coded as indicated to the left of the micrograph. BAC RP23-201H14 was used to mark IgH alleles (blue) in selected FISH analyses. It is located 200 kb 3’ of HS4. Spatial distances between probes were measured after deconvolution of images from 100 nuclei. Bar graphs show the percentage of IgH alleles in which the distance between indicated probe pairs fell in the ranges shown in different colors. The cumulative frequency distribution of spatial distances for each color-coded probe combination is shown to the right of the bar graph. D-statistics and P-values for differences between WT and IGCR1-mutated alleles were calculated using a two-sample Kolmogorov-Smirnov test (Table S1). Data from biological replicate experiments are shown in Figure S3B.
See also Figure S1–3 and Table S1, 3.

