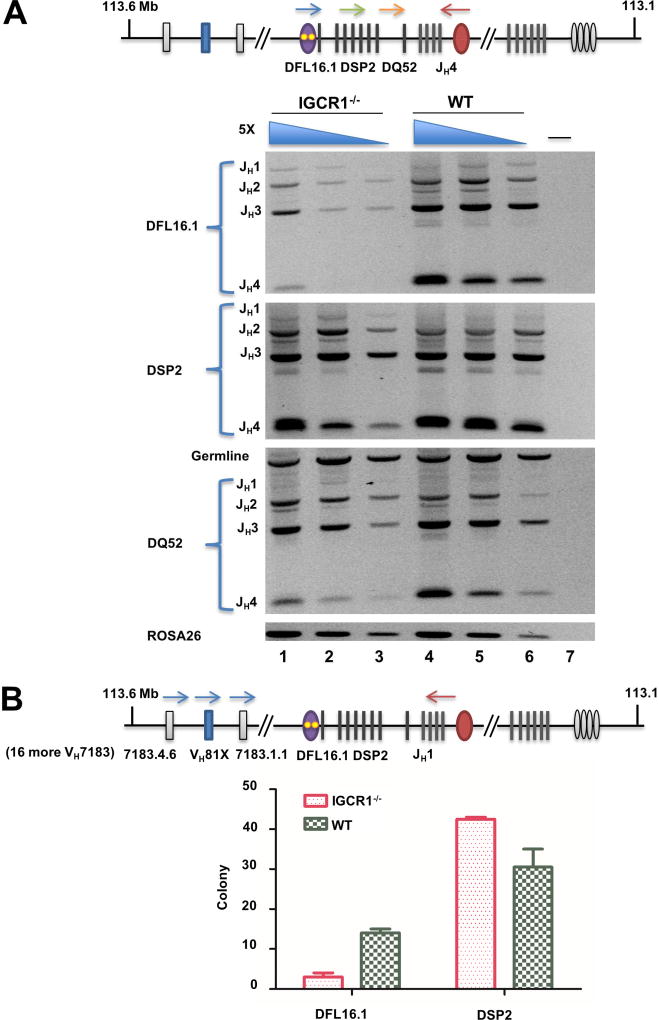
Figure 3. DH gene segment utilization on IGCR1-deleted IgH alleles in bone marrow pro-B cells.
A. Analysis of DJH junctions. Genomic DNA purified from pro-B cells (B220+IgM−CD43+) from WT and IGCR1-deleted IgH alleles(Guo et al., 2011b) was used in amplification reactions with 5’ primers specific for either DFL16.1 (blue arrow), 8 DSP2 (green arrow) or DQ52 gene segments (orange arrow) together with a 3’ primer located beyond JH4 (red arrow). Amplification products were analyzed by agarose gel electrophoresis. 5-fold increasing amounts of genomic DNA starting at 4ng (lanes 3, 6) are shown for each genotype. The non-rearranging ROSA26 locus served as a loading control. Rearrangement of each DH gene segment to the four JH gene segments is indicated to the left of the gel. Lane 7 is an amplification reaction with no genomic DNA. Two biological replicate purifications of pro-B cells were performed. Data shown is a representative rearrangement analysis from one experiment. Averaged data from both experiments is provided in Figure S5A.
B. DH utilization in VDJH junctions in pro-B cells from mice carrying WT and IGCR1-deleted IgH alleles. Pro-B cell genomic DNA was amplified using a 5’ primer specific for 19 out of 49 rearrangeable VH7183 gene segments (blue arrows and detailed in Figure S5C), including the 3’-most VH7183 gene segment indicated in the schematic, and a 3’ primer located just after JH1 (red arrow). Amplification products were sub-cloned into pGEM®-T, and 55 clones from each of two pro-B cell preparations from WT and IGCR1-deleted mice were sequenced to estimate VH and DH usage (Table S2). DFL16.1 and DSP2 utilization in each genotype ranged between 39 and 50 subclones per experiment; DH gene segment identity could not be established in the remaining clones due to end processing during VDJH recombination. Numbers of clones with DFL16.1 and DSP2 rearrangements from each genotype are shown in the graph. Data are shown as mean ± SEM of two experiments carried out with independently sorted pro-B cell preparations.
See also Figure S5 and Table S2, 3.

