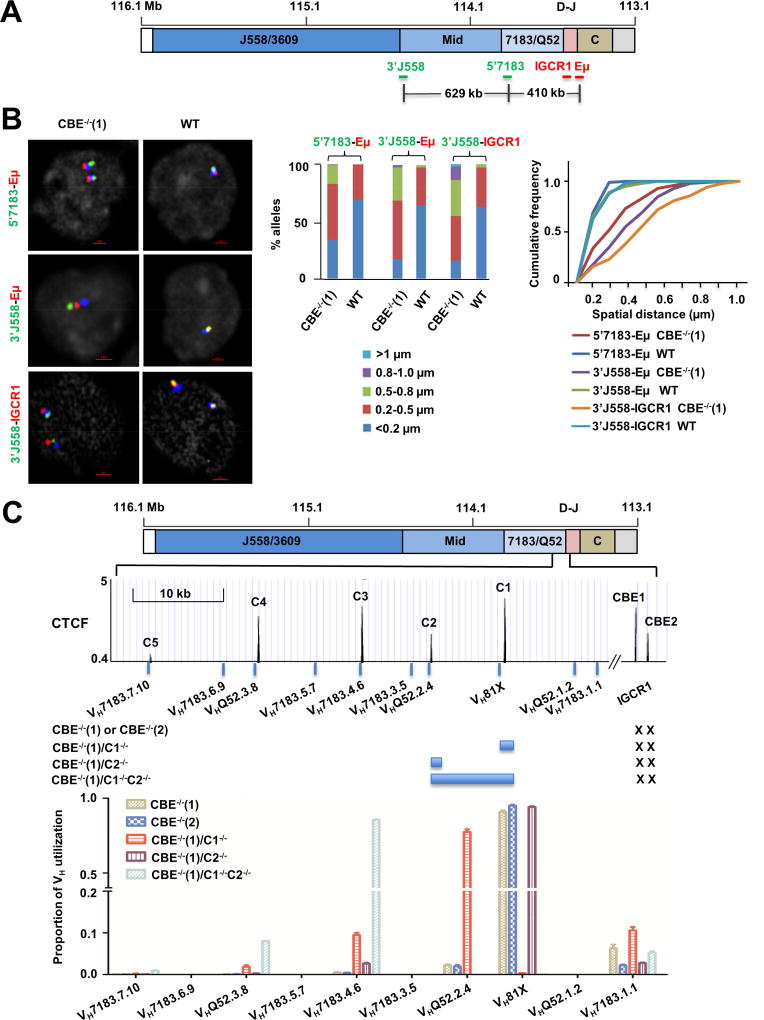
Figure 6. Re-directing VDJH recombination on IGCR1-mutated IgH alleles.
A. Scale schematic of the IgH locus indicating locations of FISH probes used to assay conformation of IGCR1-mutated alleles. Probes labeled 3’J558, 5’7183, IGCR1 and Eμ range in length from 4–10 kb, and were generated by amplification of corresponding regions (Table S3) from BACs or genomic DNA. Distances between selected probes are indicated based on mm10.
B. Analysis of VH-DJH interactions by FISH. Probes located in the VH part of the locus (5’7183, 3’J558) and in the DH-JH part of the locus (Eμ and IGCR1) were hybridized to pro-B cell lines containing WT or IGCR1-mutated (CBE−/−(1)) IgH alleles. BAC RP23-201H14 (blue) was used to mark IgH alleles. Representative nuclei are shown, with probe combinations indicated on the left. Spatial distances between probes were measured after image deconvolution from 100 nuclei. Bar graphs show the percentage of IgH alleles in which inter-probe distance fell in the ranges shown by different colors. Cumulative frequency distribution of spatial distances for each color-coded probe combination is shown to the right of the bar graph. D-statistics and P-values for differences between WT and IGCR1-mutated alleles were calculated using the two-sample Kolmogorov-Smirnov test (Table S1). At least 2 independent FISH experiments were carried out with each probe combination (Figure S8B).
C. Sequential activation of CTCF-proximal VH gene segments on IGCR1-mutated alleles. The 3’ part of the VH region is expanded below the schematic to show the location of several proximal VH gene segments and CTCF binding sites. Sites C1–C5 represent the first to fifth CTCF binding sites beyond IGCR1 (labeled CBE1 and CBE2). Sequences indicated by blue bars around C1 and C2 were deleted using CRISPR/Cas9 in the context of the IGCR1 mutated cell line CBE−/−(1) to generate cell lines CBE−/−(1)/C1−/−, CBE−/−(1)/C2−/−, and CBE−/−(1)/C1−/−C2−/−. All cell lines were infected with RAG2-expressing lentivirus to assay recombination. After 10 days selection with puromycin, genomic DNA was prepared to analyze VH utilization by deep sequencing (Hu et al., 2016). Total reads in each cell line were aligned to 128 VH genes in 129 strain mice (Retter et al., 2007). Sequences of the first 10 proximal VH accounted for 99% of reads. Proportion of VH utilization (Y axis) was calculated as a fraction of reads of a specific gene fragment for each cell line. Genomic DNA from 2 independent RAG2 infection experiments were combined for sequencing. Further details are provided in Table S4 and S5.
See also Figure S8–10 and Tables S1, 3–5.

