
Fig. 6.
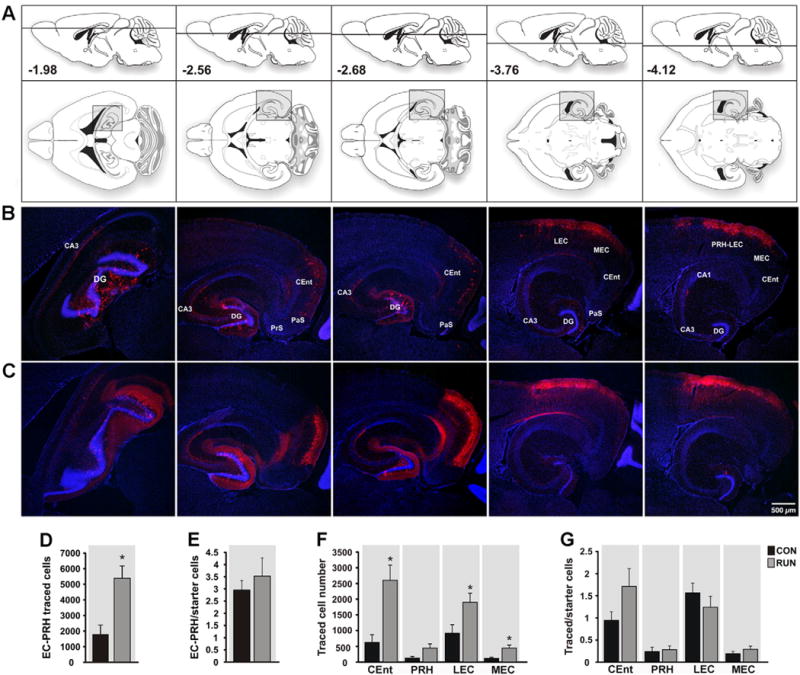
Entorhinal cortex input to new GCs is reorganized by running. (A) Modified atlas plates (Paxinos and Franklin, 2007) corresponding to the photomicrographs of sections derived from (B) CON and (C) RUN mice. Upper atlas panels show the dorso-ventral horizontal section depth (distance from Bregma). The lower images show overviews of horizontal sections; shaded areas correspond to the photomicrographs below. (B, C) Photomicrographs showing traced cells (TC) in horizontal sections derived from (B) CON and (C) RUN mice. (D) The total number of TC in entorhinal–perirhinal cortex (EC–PRH) was increased by running (t(11) = 3.55, P < 0.004; CON n = 6; RUN n = 7). (E) Running did not alter the ratio of total EC–PRH TC to SC (t(11) = 0.69; P = 0.5). (F) Within the EC, caudo-medial entorhinal cortex (CEnt), lateral entorhinal cortex (LEC), and medial entorhinal cortex (MEC) TC number was increased by running as compared to controls (CEnt, t(11) = 3.49, P < 0.005; LEC, t(11) = 2.38, P < 0.04; MEC, t(11) = 3.08, P < 0.01). (G) Running did not alter the ratio of TC to SC in the peri- and entorhinal cortices (P > 0.05). Data are means ± S.E.M. *P < 0.05. Abbreviations: parasubiculum (PaS); presubiculum (PrS).