Figure 1.

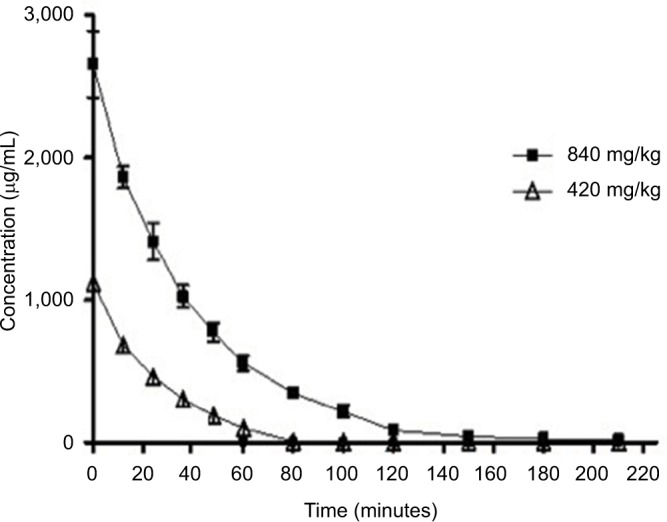
The serum concentration–time profile of D-ribose after IV administration at doses of 840 mg/kg and 420 mg/kg body weight. The values are mean ± SE.
Abbreviations: IV, intravenous; SE, standard error.

The serum concentration–time profile of D-ribose after IV administration at doses of 840 mg/kg and 420 mg/kg body weight. The values are mean ± SE.
Abbreviations: IV, intravenous; SE, standard error.