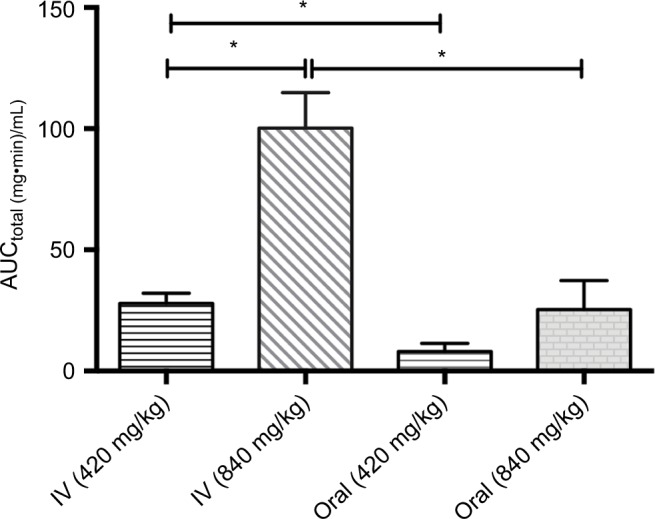
Figure 3.

The total area under the serum concentration–time curve (AUCtotal) values for the doses given orally or intravenously to the rabbits. Data are presented as mean ± SD. *p<0.05.
Abbreviation: IV, intravenous.

The total area under the serum concentration–time curve (AUCtotal) values for the doses given orally or intravenously to the rabbits. Data are presented as mean ± SD. *p<0.05.
Abbreviation: IV, intravenous.