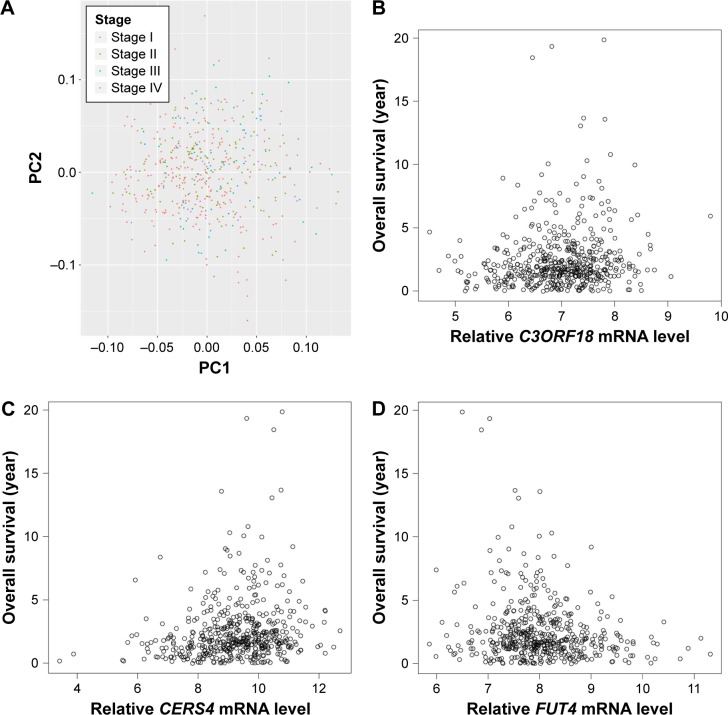
Figure 1.
Principal component analysis of raw read count and correlation analysis between selected genes expression values and sample survival in training set. (A) Principal component analysis of raw read count of samples in different clinicopathological stages in training set. Red, blue, green, and purple dots represent stage I, stage II, stage III, and stage IV, respectively. (B–D) Spearman correlation between expression value of C3ORF18, CERS4, and FUT4 and survival times of samples in training set. X-axis and Y-axis represent gene expression value and sample survival time, respectively.

