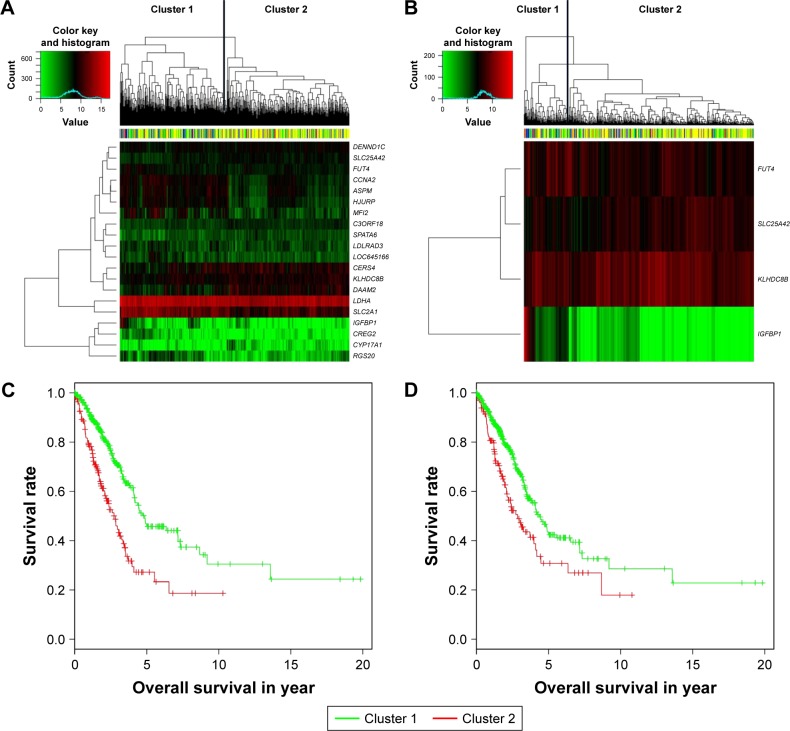
Figure 3.
Clustering and Kaplan–Meier analysis in testing set. (A and B) The hierarchical clustering of samples in testing set based on the 20 sure independent screening (SIS)-resulted genes and four overlaps. Color bar at the top of the heatmap represents stages. (C and D) The Kaplan–Meier plot of different clusters obtained based on prognostic signature of 20 and four genes, respectively.

