Fig. 1.
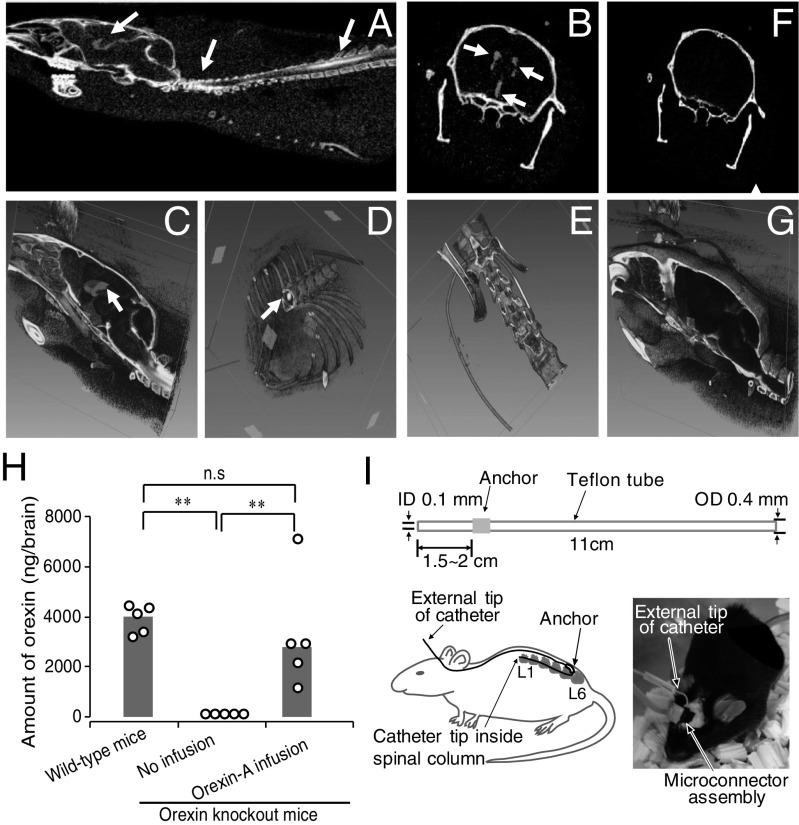
Contrast medium and orexin delivered at lumbar spinal cord level were detected in the brain. (A–D) Representative CT scan of a mouse whereby contrast medium was infused via intrathecal route. Two-dimensional axial cross-sectional sagittal (A) and coronal (B) image showing contrast medium in brain ventricles and spinal cord (arrows). (C and D) The 3D reconstructed image showing contrast medium at brain ventricles and spinal cord (arrows). (E–G) CT scan of a control mouse with a misplaced catheter (E). Two-dimensional coronal (F) and 3D sagittal (G) brain images where no contrast medium was detected. (H) Orexin peptide content in brains of orexin knockout mice with and without orexin-A infusion. Circles represent values of the individual mouse and gray bars show median values. n = 5; **P ≤ 0.01 by using one-way ANOVA, followed by Fisher’s probable least-squares difference (LSD) test. (I) Schematic representation of the construction of the intrathecal catheter. (Upper) Catheter dimensions; (Lower Left) an overview sketch of catheter implantation; and (Lower Right) picture of intact animal after surgery connected to recording leads and infusion system. ID, inside diameter; n.s., not significant; OD, outside diameter.

